Quantcast
Channel: Severalnines - galera cluster
Viewing all 97 articles
Browse latest View live

How to set up read-write split in Galera Cluster using ProxySQL

$
0
0

Edited on Sep 12, 2016 to correct the description of how ProxySQL handles session variables. Many thanks to Francisco Miguel for pointing this out.


ProxySQL is becoming more and more popular as SQL-aware load balancer for MySQL and MariaDB. In previous blog posts, we covered installation of ProxySQL and its configuration in a MySQL replication environment. We’ve covered how to set up ProxySQL to perform failovers executed from ClusterControl. At that time, Galera support in ProxySQL was a bit limited - you could configure Galera Cluster and split traffic across all nodes but there was no easy way to implement read-write split of your traffic. The only way to do that was to create a daemon which would monitor Galera state and update weights of backend servers defined in ProxySQL - a much more complex task than to write a small bash script.

In one of the recent ProxySQL releases, a very important feature was added - a scheduler, which allows to execute external scripts from within ProxySQL even as often as every millisecond (well, as long as your script can execute within this time frame). This feature creates an opportunity to extend ProxySQL and implement setups which were not possible to build easily in the past due to too low granularity of the cron schedule. In this blog post, we will show you how to take advantage of this new feature and create a Galera Cluster with read-write split performed by ProxySQL.

First, we need to install and start ProxySQL:

[root@ip-172-30-4-215 ~]# wget https://github.com/sysown/proxysql/releases/download/v1.2.1/proxysql-1.2.1-1-centos7.x86_64.rpm

[root@ip-172-30-4-215 ~]# rpm -i proxysql-1.2.1-1-centos7.x86_64.rpm
[root@ip-172-30-4-215 ~]# service proxysql start
Starting ProxySQL: DONE!

Next, we need to download a script which we will use to monitor Galera status. Currently it has to be downloaded separately but in the next release of ProxySQL it should be included in the rpm. The script needs to be located in /var/lib/proxysql.

[root@ip-172-30-4-215 ~]# wget https://raw.githubusercontent.com/sysown/proxysql/master/tools/proxysql_galera_checker.sh

[root@ip-172-30-4-215 ~]# mv proxysql_galera_checker.sh /var/lib/proxysql/
[root@ip-172-30-4-215 ~]# chmod u+x /var/lib/proxysql/proxysql_galera_checker.sh

If you are not familiar with this script, you can check what arguments it accepts by running:

[root@ip-172-30-4-215 ~]# /var/lib/proxysql/proxysql_galera_checker.sh
Usage: /var/lib/proxysql/proxysql_galera_checker.sh <hostgroup_id write> [hostgroup_id read] [number writers] [writers are readers 0|1} [log_file]

As we can see, we need to pass couple of arguments - hostgroups for writers and readers, number of writers which should be active at the same time. We also need to pass information if writers can be used as readers and, finally, path to a log file.

Next, we need to connect to ProxySQL’s admin interface. For that you need to know credentials - you can find them in a configuration file, typically located in /etc/proxysql.cnf:

admin_variables=
{
        admin_credentials="admin:admin"
        mysql_ifaces="127.0.0.1:6032;/tmp/proxysql_admin.sock"
#       refresh_interval=2000
#       debug=true
}

Knowing the credentials and interfaces on which ProxySQL listens, we can connect to the admin interface and begin configuration.

[root@ip-172-30-4-215 ~]# mysql -P6032 -uadmin -padmin -h 127.0.0.1

First, we need to fill mysql_servers table with information about our Galera nodes. We will add them twice, to two different hostgroups. One hostgroup (with hostgroup_id of 0) will handle writes while the second hostgroup (with hostgroup_id of 1) will handle reads.

MySQL [(none)]> INSERT INTO mysql_servers (hostgroup_id, hostname, port) VALUES (0, '172.30.4.238', 3306), (0, '172.30.4.184', 3306), (0, '172.30.4.67', 3306);
Query OK, 3 rows affected (0.00 sec)

MySQL [(none)]> INSERT INTO mysql_servers (hostgroup_id, hostname, port) VALUES (1, '172.30.4.238', 3306), (1, '172.30.4.184', 3306), (1, '172.30.4.67', 3306);
Query OK, 3 rows affected (0.00 sec)

Next, we need to add information about users which will be used by the application. We used a plain text password here but ProxySQL accepts also hashed passwords in MySQL format.

MySQL [(none)]> INSERT INTO mysql_users (username, password, active, default_hostgroup) VALUES ('sbtest', 'sbtest', 1, 0);
Query OK, 1 row affected (0.00 sec)

What’s important to keep in mind is the default_hostgroup setting - we set it to ‘0’ which means that, unless one of query rules say different, all queries will be sent to the hostgroup 0 - our writers.

At this point we need to define query rules which will handle read/write split. First, we want to match all SELECT queries:

MySQL [(none)]> INSERT INTO mysql_query_rules (active, match_pattern, destination_hostgroup, apply) VALUES (1, '^SELECT.*', 1, 0);
Query OK, 1 row affected (0.00 sec)

It is important to make sure you get the regex correctly. It is also crucial to note that we set ‘apply’ column to ‘0’. This means that our rule won’t be the final one - a query, even if it matches the regex, will be tested against next rule in the chain. You can see why we’ve done that when you look at our second rule:

MySQL [(none)]> INSERT INTO mysql_query_rules (active, match_pattern, destination_hostgroup, apply) VALUES (1, '^SELECT.*FOR UPDATE', 0, 1);
Query OK, 1 row affected (0.00 sec)

We are looking for SELECT … FOR UPDATE queries, that’s why we couldn’t just finish checking our SELECT queries on the first rule. SELECT … FOR UPDATE should be routed to our write hostgroup, where UPDATE will happen.

Those settings will work fine if autocommit is enabled and no explicit transactions are used. If your application uses transactions, one of the methods to make them work safely in ProxySQL is to use the following set of queries:

SET autocommit=0;
BEGIN;
...

The transaction is created and it will stick to the host where it was opened. You also need to have a query rule for BEGIN, which would route it to the hostgroup for writers - in our case we leverage the fact that, by default, all queries executed as ‘sbtest’ user are routed to writers’ hostgroup (‘0’) so there’s no need to add anything.

Second method would be to enable persistent transactions for our user (transaction_persistent column in mysql_users table should be set to ‘1’).

ProxySQL’s handling of other SET statements and user-defined variables is another thing we’d like to discuss a bit here. ProxySQL works on two levels of routing. First - query rules. You need to make sure all your queries are routed accordingly to your needs. Then, connection mutiplexing - even when routed to the same host, every query you issue may in fact use a different connection to the backend. This makes things hard for session variables. Luckily, ProxySQL treats all queries containing ‘@’ character in a special way - once it detects it, it disables connection multiplexing for the duration of that session - thanks to that, we don’t have to be worried that the next query won’t know a thing about our session variable.

The only thing we need to make sure of is that we end up in the correct hostgroup before disabling connection multiplexing. To cover all cases, the ideal hostgroup in our setup would be the one with writers. This would require slight change in the way we set our query rules (you may require to run ‘DELETE FROM mysql_query_rules’ if you already added the query rules we mentioned earlier).

MySQL [(none)]> INSERT INTO mysql_query_rules (active, match_pattern, destination_hostgroup, apply) VALUES (1, '.*@.*', 0, 1);
Query OK, 1 row affected (0.00 sec)

MySQL [(none)]> INSERT INTO mysql_query_rules (active, match_pattern, destination_hostgroup, apply) VALUES (1, '^SELECT.*', 1, 0);
Query OK, 1 row affected (0.00 sec)

MySQL [(none)]> INSERT INTO mysql_query_rules (active, match_pattern, destination_hostgroup, apply) VALUES (1, '^SELECT.*FOR UPDATE', 0, 1);
Query OK, 1 row affected (0.00 sec)

Those two cases could become a problem in our setup but as long as you are not affected by them (or if you used the proposed workarounds), we can proceed further with configuration. We still need to setup our script to be executed from ProxySQL:

MySQL [(none)]> INSERT INTO scheduler (id, active, interval_ms, filename, arg1, arg2, arg3, arg4, arg5) VALUES (1, 1, 1000, '/var/lib/proxysql/proxysql_galera_checker.sh', 0, 1, 1, 1, '/var/lib/proxysql/proxysql_galera_checker.log');
Query OK, 1 row affected (0.01 sec)

Additionally, because of the way how Galera handles dropped nodes, we want to increase the number of attempts that ProxySQL will make before it decides a host cannot be reached.

MySQL [(none)]> SET mysql-query_retries_on_failure=10;
Query OK, 1 row affected (0.00 sec)

Finally, we need to apply all changes we made to the runtime configuration and save them to disk.

MySQL [(none)]> LOAD MYSQL USERS TO RUNTIME; SAVE MYSQL USERS TO DISK; LOAD MYSQL QUERY RULES TO RUNTIME; SAVE MYSQL QUERY RULES TO DISK; LOAD MYSQL SERVERS TO RUNTIME; SAVE MYSQL SERVERS TO DISK; LOAD SCHEDULER TO RUNTIME; SAVE SCHEDULER TO DISK; LOAD MYSQL VARIABLES TO RUNTIME; SAVE MYSQL VARIABLES TO DISK;
Query OK, 0 rows affected (0.00 sec)

Query OK, 0 rows affected (0.02 sec)

Query OK, 0 rows affected (0.00 sec)

Query OK, 0 rows affected (0.02 sec)

Query OK, 0 rows affected (0.00 sec)

Query OK, 0 rows affected (0.02 sec)

Query OK, 0 rows affected (0.00 sec)

Query OK, 0 rows affected (0.01 sec)

Query OK, 0 rows affected (0.00 sec)

Query OK, 64 rows affected (0.05 sec)

Ok, let’s see how things work together. First, verify that our script works by looking at /var/lib/proxysql/proxysql_galera_checker.log:

Fri Sep  2 21:43:15 UTC 2016 Check server 0:172.30.4.184:3306 , status ONLINE , wsrep_local_state 4
Fri Sep  2 21:43:15 UTC 2016 Check server 0:172.30.4.238:3306 , status OFFLINE_SOFT , wsrep_local_state 4
Fri Sep  2 21:43:15 UTC 2016 Changing server 0:172.30.4.238:3306 to status ONLINE
Fri Sep  2 21:43:15 UTC 2016 Check server 0:172.30.4.67:3306 , status OFFLINE_SOFT , wsrep_local_state 4
Fri Sep  2 21:43:15 UTC 2016 Changing server 0:172.30.4.67:3306 to status ONLINE
Fri Sep  2 21:43:15 UTC 2016 Check server 1:172.30.4.184:3306 , status ONLINE , wsrep_local_state 4
Fri Sep  2 21:43:15 UTC 2016 Check server 1:172.30.4.238:3306 , status ONLINE , wsrep_local_state 4
Fri Sep  2 21:43:16 UTC 2016 Check server 1:172.30.4.67:3306 , status ONLINE , wsrep_local_state 4
Fri Sep  2 21:43:16 UTC 2016 Number of writers online: 3 : hostgroup: 0
Fri Sep  2 21:43:16 UTC 2016 Number of writers reached, disabling extra write server 0:172.30.4.238:3306 to status OFFLINE_SOFT
Fri Sep  2 21:43:16 UTC 2016 Number of writers reached, disabling extra write server 0:172.30.4.67:3306 to status OFFLINE_SOFT
Fri Sep  2 21:43:16 UTC 2016 Enabling config

Looks ok. Next we can check mysql_servers table:

MySQL [(none)]> select hostgroup_id, hostname, status from mysql_servers;
+--------------+--------------+--------------+
| hostgroup_id | hostname     | status       |
+--------------+--------------+--------------+
| 0            | 172.30.4.238 | OFFLINE_SOFT |
| 0            | 172.30.4.184 | ONLINE       |
| 0            | 172.30.4.67  | OFFLINE_SOFT |
| 1            | 172.30.4.238 | ONLINE       |
| 1            | 172.30.4.184 | ONLINE       |
| 1            | 172.30.4.67  | ONLINE       |
+--------------+--------------+--------------+
6 rows in set (0.00 sec)

Again, everything looks as expected - one host is taking writes (172.30.4.184), all three are handling reads. Let’s start sysbench to generate some traffic and then we can check how ProxySQL will handle failure of the writer host.

[root@ip-172-30-4-215 ~]# while true ; do sysbench --test=/root/sysbench/sysbench/tests/db/oltp.lua --num-threads=6 --max-requests=0 --max-time=0 --mysql-host=172.30.4.215 --mysql-user=sbtest --mysql-password=sbtest --mysql-port=6033 --oltp-tables-count=32 --report-interval=1 --oltp-skip-trx=on --oltp-read-only=off --oltp-table-size=100000  run ;done

We are going to simulate a crash by killing the mysqld process on host 172.30.4.184. This is what you’ll see on the application side:

[  45s] threads: 6, tps: 0.00, reads: 4891.00, writes: 1398.00, response time: 23.67ms (95%), errors: 0.00, reconnects:  0.00
[  46s] threads: 6, tps: 0.00, reads: 4973.00, writes: 1425.00, response time: 25.39ms (95%), errors: 0.00, reconnects:  0.00
[  47s] threads: 6, tps: 0.00, reads: 5057.99, writes: 1439.00, response time: 22.23ms (95%), errors: 0.00, reconnects:  0.00
[  48s] threads: 6, tps: 0.00, reads: 2743.96, writes: 774.99, response time: 23.26ms (95%), errors: 0.00, reconnects:  0.00
[  49s] threads: 6, tps: 0.00, reads: 0.00, writes: 1.00, response time: 0.00ms (95%), errors: 0.00, reconnects:  0.00
[  50s] threads: 6, tps: 0.00, reads: 0.00, writes: 0.00, response time: 0.00ms (95%), errors: 0.00, reconnects:  0.00
[  51s] threads: 6, tps: 0.00, reads: 0.00, writes: 0.00, response time: 0.00ms (95%), errors: 0.00, reconnects:  0.00
[  52s] threads: 6, tps: 0.00, reads: 0.00, writes: 0.00, response time: 0.00ms (95%), errors: 0.00, reconnects:  0.00
[  53s] threads: 6, tps: 0.00, reads: 0.00, writes: 0.00, response time: 0.00ms (95%), errors: 0.00, reconnects:  0.00
[  54s] threads: 6, tps: 0.00, reads: 1235.02, writes: 354.01, response time: 6134.76ms (95%), errors: 0.00, reconnects:  0.00
[  55s] threads: 6, tps: 0.00, reads: 5067.98, writes: 1459.00, response time: 24.95ms (95%), errors: 0.00, reconnects:  0.00
[  56s] threads: 6, tps: 0.00, reads: 5131.00, writes: 1458.00, response time: 22.07ms (95%), errors: 0.00, reconnects:  0.00
[  57s] threads: 6, tps: 0.00, reads: 4936.02, writes: 1414.00, response time: 22.37ms (95%), errors: 0.00, reconnects:  0.00
[  58s] threads: 6, tps: 0.00, reads: 4929.99, writes: 1404.00, response time: 24.79ms (95%), errors: 0.00, reconnects:  0.00

There’s a ~5 seconds break but otherwise, no error was reported. Of course, your mileage may vary - all depends on Galera settings and your application. Such feat might not be possible if you use transactions in your application.

To summarize, we showed you how to configure read-write split in Galera Cluster using ProxySQL. There are a couple of limitations due to the way the proxy works, but as long as none of them are a blocker, you can use it and benefit from other ProxySQL features like caching or query rewriting. Please also keep in mind that the script we used for setting up read-write split is just an example which comes from ProxySQL. If you’d like it to cover more complex cases, you can easily write one tailored to your needs.


Watch the tutorial: backup best practices for MySQL, MariaDB and Galera Cluster

$
0
0

Many thanks to everyone who registered and/or participated in Tuesday’s webinar on backup strategies and best practices for MySQL, MariaDB and Galera clusters led by Krzysztof Książek, Senior Support Engineer at Severalnines. If you missed the session, would like to watch it again or browse through the slides, they’re now online for viewing. Also check out the transcript of the Q&A session below.

Watch the webinar replay

Whether you’re a SysAdmin, DBA or DevOps professional operating MySQL, MariaDB or Galera clusters in production, you should make sure that your backups are scheduled, executed and regularly tested. Krzysztof shared some of his key best practice tips & tricks yesterday on how to do just that; including a live demo with ClusterControl. In short, this webinar replay shows you the pros and cons of different backup options and helps you pick the one that goes best with your environment.

Happy backuping!

Questions & Answers

Q. Can we control I/O while taking the backups with mysqldump and mysqldumper (I’ve used nice before, but it wasn’t helpful).

A. Theoretically it might be possible, although we haven’t really tested that. If you really want to apply some throttling then you may want to look into cgroups - it should help you to throttle I/O activity on a per-process basis.

Q. Can we take mydumper with ClusterControl and is ClusterControl is free software?

A. We don't currently support it, but you can always use it manually; ClusterControl doesn't prevent you from using this tool. There is a free community version of ClusterControl, yes, though its backup features are part of the commercial version. With the free community version you can deploy and monitor your database (clusters) as well as develop your own custom database advisors. You also have a one-month trial period that gives you access to all of ClusterControl’s features. You can find all the feature details here: https://severalnines.com/pricing

Q. Can xtrabackup work with data-at-rest encryption?

A. It can work with encrypted data in MySQL or Percona Server - it is because they encrypt only tablespaces, which xtrabackup just copies - it doesn’t have to access contents of tablespaces. MariaDB encrypts not only tablespaces but also, for example, InnoDB redo logs, which have to be accessed by xtrabackup - therefore xtrabackup cannot work with data-at-rest encryption as implemented in MariaDB. Because of this MariaDB Corporation forked xtrabackup into MariaDB Backup. This tool supports encryption done by MariaDB.

Q. Can you use mydumper for point-in-time recovery?

A. Yes, it is possible. mydumper can store GTID data so you can identify last applied transaction and use it as a starting position for processing binary logs.

Q. Is it a problem if we use binary logs with xtrabackup with start-datetime and end-datetime instead of start-position and end-position? We make a full backup on Fridays and every other day an incremental backup. When we need to recover we take the last full and all incremental backups and the binary logs from this day starting from 00:00 to NOW ... could there be a problem with apply-log?

A. In general, you should not use --start-datetime or --end-datetime when you want to reply binary log on the database. It’s not granular enough - it has a resolution of one second and there could be many transactions that happened during that second. You can use it to minimize timeframe to look for manually, but that’s all. If you want to replay binary logs, you should use --start-position and --end-position. Only this will precisely define from which event you will replay binlogs and on which event it’ll end up.

Q. Should I run the dump software on load balancer or one of the MySQL nodes?

A. Typically you’ll use it on MySQL nodes. Some of the tools can only do just that. For example, Xtrabackup - you have to run it locally, on the database host. You can stream output to another location, but it has to be started locally.

Q. Can we take partial backups with ClusterControl? And if yes, how can we restore a backup on a running instance?

A. Yes, you can take a partial backup using ClusterControl (you can backup separate schema using xtrabackup) but, as of now, you cannot restore a partial backup on a running instance. This is caused by the fact that the schema you’d recover will not be consistent with the rest of the cluster. To make it consistent, the cluster has to be bootstrapped from the node on which you restore a backup. So, technically, the node runs all the time but it’s a fairly heavy and invasive operation. This will change in the next version of ClusterControl in which you’d be able to restore backups on a separate host. From that host you could then dump contents of a restored schema using mysqldump (or mydumper) and restore it on a production cluster.

Q. Can you please share the mysqldumper command?

A. It’s rather hard to answer this question without doing copy and paste from the documentation, so we think it will be the best if we’d point you to the documentation: https://github.com/maxbube/mydumper/tree/master/docs

Watch the webinar replay

Galera Cluster: All the Severalnines Resources

$
0
0

Galera Cluster is a true multi-master cluster solution for MySQL and MariaDB, based on synchronous replication. Galera Cluster is easy-to-use, provides high-availability, as well as scalability for certain workloads.

ClusterControl provides advanced deployment, management, monitoring, and scaling functionality to get your Galera clusters up-and-running using proven methodologies.

Here are just some of the great resources we’ve developed for Galera Cluster over the last few years...

Tutorials

Galera Cluster for MySQL

Galera allows applications to read and write from any MySQL Server. Galera enables synchronous replication for InnoDB, creating a true multi-master cluster of MySQL servers. Allows for synchronous replication between data centers. Our tutorial covers MySQL Galera concepts and explains how to deploy and manage a Galera cluster.

Read the Tutorial

Deploying a Galera Cluster for MySQL on Amazon VPC

This tutorial shows you how to deploy a multi-master synchronous Galera Cluster for MySQL with Amazon's Virtual Private Cloud (Amazon VPC) service.

Read the Tutorial

Training: Galera Cluster For System Administrators, DBAs And DevOps

The course is designed for system administrators & database administrators looking to gain more in depth expertise in the automation and management of Galera Clusters.

Book Your Seat

On-Demand Webinars

MySQL Tutorial - Backup Tips for MySQL, MariaDB & Galera Cluster

In this webinar, Krzysztof Książek, Senior Support Engineer at Severalnines, discusses backup strategies and best practices for MySQL, MariaDB and Galera clusters; including a live demo on how to do this with ClusterControl.

Watch the replay

9 DevOps Tips for Going in Production with Galera Cluster for MySQL / MariaDB

In this webinar replay, we guide you through 9 key tips to consider before taking Galera Cluster for MySQL / MariaDB into production.

Watch the replay

Deep Dive Into How To Monitor MySQL or MariaDB Galera Cluster / Percona XtraDB Cluster

Our colleague Krzysztof Książek provided a deep-dive session on what to monitor in Galera Cluster for MySQL & MariaDB. Krzysztof is a MySQL DBA with experience in managing complex database environments for companies like Zendesk, Chegg, Pinterest and Flipboard.

Watch the replay

Become a MySQL DBA - webinar series: Schema Changes for MySQL Replication & Galera Cluster

In this webinar, we discuss how to implement schema changes in the least impacting way to your operations and ensure availability of your database. We also cover some real-life examples and discuss how to handle them.

Watch the replay

Migrating to MySQL, MariaDB Galera and/or Percona XtraDB Cluster

In this webinar, we walk you through what you need to know in order to migrate from standalone or a master-slave MySQL / MariaDB setup to Galera Cluster.

Watch the replay

Introducing Galera 3.0

In this webinar you'll learn all about the new Galera Cluster capabilities in version 3.0.

Watch the replay

Top Blogs

MySQL on Docker: Running Galera Cluster on Kubernetes

In our previous posts, we showed how one can run Galera Cluster on Docker Swarm, and discussed some of the limitations with regards to production environments. Kubernetes is widely used as orchestration tool, and we’ll see whether we can leverage it to achieve production-grade Galera Cluster on Docker.

Read More

ClusterControl for Galera Cluster for MySQL

Galera Cluster is widely supported by ClusterControl. With over four thousand deployments and more than sixteen thousand configurations, you can be assured that ClusterControl is more than capable of helping you manage your Galera setup.

Read More

How Galera Cluster Enables High Availability for High Traffic Websites

This post gives an insight into how Galera can help to build HA websites.

Read More

How to Set Up Asynchronous Replication from Galera Cluster to Standalone MySQL server with GTID

Hybrid replication, i.e. combining Galera and asynchronous MySQL replication in the same setup, became much easier since GTID got introduced in MySQL 5.6. In this blog post, we will show you how to replicate a Galera Cluster to a MySQL server with GTID, and how to failover the replication in case the master node fails.

Read More

Full Restore of a MySQL or MariaDB Galera Cluster from Backup

Performing regular backups of your database cluster is imperative for high availability and disaster recovery. This blog post provides a series of best practices on how to fully restore a MySQL or MariaDB Galera Cluster from backup.

Read More

How to Bootstrap MySQL or MariaDB Galera Cluster

Unlike standard MySQL server and MySQL Cluster, the way to start a MySQL or MariaDB Galera Cluster is a bit different. Galera requires you to start a node in a cluster as a reference point, before the remaining nodes are able to join and form the cluster. This process is known as cluster bootstrap. Bootstrapping is an initial step to introduce a database node as primary component, before others see it as a reference point to sync up data.

Read More

Schema changes in Galera cluster for MySQL and MariaDB - how to avoid RSU locks

This post shows you how to avoid locking existing queries when performing rolling schema upgrades in Galera Cluster for MySQL and MariaDB.

Read More

Deploy an asynchronous slave to Galera Cluster for MySQL - The Easy Way

Due to its synchronous nature, Galera performance can be limited by the slowest node in the cluster. So running heavy reporting queries or making frequent backups on one node, or putting a node across a slow WAN link to a remote data center might indirectly affect cluster performance. Combining Galera and asynchronous MySQL replication in the same setup, aka Hybrid Replication, can help

Read More

Top Videos

ClusterControl for Galera Cluster - All Inclusive Database Management System

Watch the Video

Galera Cluster - ClusterControl Product Demonstration

Watch the Video

ClusterControl
Single Console for Your Entire Database Infrastructure
Find out what else is new in ClusterControl

ClusterControl for Galera

ClusterControl makes it easy for those new to Galera to use the technology and deploy their first clusters. It centralizes the database management into a single interface. ClusterControl automation ensures DBAs and SysAdmins make critical changes to the cluster efficiently with minimal risks.

ClusterControl delivers on an array of features to help manage and monitor your open source database environments:

  • Deploy Database Clusters
  • Add Node, Load Balancer (HAProxy, ProxySQL) or Replication Slave
  • Backup Management
  • Configuration Management
  • Full stack monitoring (DB/LB/Host)
  • Query Monitoring
  • Enable SSL Encryption Galera Replication
  • Node Management
  • Developer Studio with Advisors

Learn more about how ClusterControl can help you drive high availability with Galera Cluster here.

We hope that these resources prove useful!

Happy Clustering!

A How-To Guide for Galera Cluster - Updated Tutorial

$
0
0

Since it was originally published more than 63,000 people (to date) have leveraged the MySQL for Galera Cluster Tutorial to both learn about and get started using MySQL Galera Cluster.

Galera Cluster for MySQL is a true Multi-master Cluster which is based on synchronous replication. Galera Cluster is an easy-to-use, high-availability solution, which provides high system uptime, no data loss and scalability to allow for future growth.

Severalnines was a very early adopter of the Galera Cluster technology; which was created by Codership and has since expanded to include versions from Percona and MariaDB.  

Included in this newly updated tutorial are topics like…

  • An introduction to Galera Cluster
  • An explanation of the differences between MySQL Replication and Galera Replication
  • Deployment of Galera Cluster
  • Accessing the Galera Cluster
  • Failure Handling
  • Management and Operations
  • FAQs and Common Questions

Check out the updated tutorial MySQL for Galera Cluster here.

ClusterControl
Single Console for Your Entire Database Infrastructure
Find out what else is new in ClusterControl

ClusterControl for Galera

ClusterControl makes it easy for those new to Galera to use the technology and deploy their first clusters. It centralizes the database management into a single interface. ClusterControl automation ensures DBAs and SysAdmins make critical changes to the cluster efficiently with minimal risks.

ClusterControl delivers on an array of features to help manage and monitor your open source database environments:

  • Deploy Database Clusters
  • Add Node, Load Balancer (HAProxy, ProxySQL) or Replication Slave
  • Backup Management
  • Configuration Management
  • Full stack monitoring (DB/LB/Host)
  • Query Monitoring
  • Enable SSL Encryption Galera Replication
  • Node Management
  • Developer Studio with Advisors

Learn more about how ClusterControl can help you drive high availability with Galera Cluster here.

Multiple Data Center Setups Using Galera Cluster for MySQL or MariaDB

$
0
0

Building high availability, one step at a time

When it comes to database infrastructure, we all want it. We all strive to build a highly available setup. Redundancy is the key. We start to implement redundancy at the lowest level and continue up the stack. It starts with hardware - redundant power supplies, redundant cooling, hot-swap disks. Network layer - multiple NIC’s bonded together and connected to different switches which are using redundant routers. For storage we use disks set in RAID, which gives better performance but also redundancy. Then, on the software level, we use clustering technologies: multiple database nodes working together to implement redundancy: MySQL Cluster, Galera Cluster.

All of this is no good  if you have everything in a single datacenter: when a datacenter goes down, or part of the services (but important ones) go offline, or even if you lose connectivity to the datacenter, your service will go down -  no matter the amount of redundancy in the lower levels. And yes, those things happens.

  • S3 service disruption wreaked havoc in US-East-1 region in February, 2017
  • EC2 and RDS Service Disruption in US-East region in April, 2011
  • EC2, EBS and RDS were disrupted in EU-West region in August, 2011
  • Power outage brought down Rackspace Texas DC in June, 2009
  • UPS failure caused hundreds of servers to go offline in Rackspace London DC in January, 2010

This is by no means a complete list of failures, it’s just the result of a quick Google search. These serve as examples that things may and will go wrong if you put all your eggs into the same basket. One more example would be Hurricane Sandy, which caused enormous exodus of data from US-East to US-West DC’s - at that time you could hardly spin up instances in US-West as everyone rushed to move their infrastructure to the other coast in expectation that North Virginia DC will be seriously affected by the weather.

So, multi-datacenter setups are a must if you want to build a high availability environment. In this blog post, we will discuss how to build such infrastructure using Galera Cluster for MySQL/MariaDB.

Galera concepts

Before we look into particular solutions, let us spend some time explaining two concepts which are very important in highly available, multi-DC Galera setups.

Quorum

High availability requires resources - namely, you need a number of nodes in the cluster to make it highly available. A cluster can tolerate the loss of some of its members, but only to a certain extent. Beyond a certain failure rate, you might be looking at a split-brain scenario.

Let’s take an example with a 2 node setup.  If one of the nodes goes down, how can the other one know that its peer crashed and it’s not a network failure? In that case, the other node might as well be up and running, serving traffic. There is no good way to handle such case… This is why fault tolerance usually starts from three nodes. Galera uses a quorum calculation to determine if it is safe for the cluster to handle traffic, or if it should cease operations. After a failure, all remaining nodes attempt to connect to each other and determine how many of them are up. It’s then compared to the previous state of the cluster, and as long as more than 50% of the nodes are up, the cluster can continue to operate.

This results in following:
2 node cluster - no fault tolerance
3 node cluster - up to 1 crash
4 node cluster - up to 1 crash (if two nodes would crash, only 50% of the cluster would be available, you need more than 50% nodes to survive)
5 node cluster - up to 2 crashes
6 node cluster - up to 2 crashes

You probably see the pattern - you want your cluster to have an odd number of nodes - in terms of high availability there’s no point in moving from 5 to 6 nodes in the cluster. If you want better fault tolerance, you should go for 7 nodes.

Segments

Typically, in a Galera cluster, all communication follows the all to all pattern. Each node talks to all the other nodes in the cluster.

As you may know, each writeset in Galera has to be certified by all of the nodes in the cluster - therefore every write that happened on a node has to be transferred to all of the nodes in the cluster. This works ok in a low-latency environment. But if we are talking about multi-DC setups, we need to consider much higher latency than in a local network. To make it more bearable in clusters spanning over Wide Area Networks, Galera introduced segments.

They work by containing the Galera traffic within a group of nodes (segment). All nodes within a single segment act as if they were in a local network - they assume one to all communication. For cross-segment traffic, things are different - in each of the segments, one “relay” node is chosen, all of the cross-segment traffic goes through those nodes. When a relay node goes down, another node is elected. This does not reduce latency by much - after all, WAN latency will stay the same no matter if you make a connection to one remote host or to multiple remote hosts, but given that WAN links tend to be limited in bandwidth and there might be a charge for the amount of data transferred, such approach allows you to limit the amount of data exchanged between segments. Another time and cost-saving option is the fact that nodes in the same segment are prioritized when a donor is needed - again, this limits the amount of data transferred over the WAN and, most likely, speeds up SST as a local network almost always will be faster than a WAN link.

ClusterControl
Single Console for Your Entire Database Infrastructure
Find out what else is new in ClusterControl

Galera in multi-DC setups

Now that we’ve got some of these concepts out of the way, let’s look at some other important aspects of multi-DC setups for Galera cluster.

Issues you are about to face

When working in environments spanning across WAN, there are a couple of issues you need to take under consideration when designing your environment.

Quorum calculation

In the previous section, we described how a quorum calculation looks like in Galera cluster - in short, you want to have an odd number of nodes to maximize survivability. All of that is still true in multi-DC setups, but some more elements are added into the mix. First of all, you need to decide if you want Galera to automatically handle a datacenter failure. This will determine how many datacenters you are going to use. Let’s imagine two DC’s - if you’ll split your nodes 50% - 50%, if one datacenter goes down, the second one doesn’t have 50%+1 nodes to maintain its “primary” state. If you split your nodes in an uneven way, using the majority of them in the “main” datacenter, when that datacenter goes down, the “backup” DC won’t have 50% + 1 nodes to form a quorum. You can assign different weights to nodes but the result will be exactly the same - there’s no way to automatically failover between two DC’s without manual intervention. To implement automated failover, you need more than two DC’s. Again, ideally an odd number - three datacenters is a perfectly fine setup. Next, the question is - how many nodes you need to have? You want to have them evenly distributed across the datacenters. The rest is just a matter of how many failed nodes your setup has to handle.

Minimal setup will use one node per datacenter - it has serious drawbacks, though. Every state transfer will require moving data across the WAN and this results in either longer time needed to complete SST or higher costs.

Quite typical setup is to have six nodes, two per datacenter. This setup seems unexpected as it has an even number of nodes. But, when you think of it, it might not be that big of an issue: it’s quite unlikely that three nodes will go down at once, and such a setup will survive a crash of up to two nodes. A whole datacenter may go offline and two remaining DC’s will continue operations. It also has a huge advantage over the minimal setup - when a node goes offline, there’s always a second node in the datacenter which can serve as a donor. Most of the time, the WAN won’t be used for SST.

Of course, you can increase the number of nodes to three per cluster, nine in total. This gives you even better survivability: up to four nodes may crash and the cluster will still survive. On the other hand, you have to keep in mind that, even with the use of segments, more nodes means higher overhead of operations and you can scale out Galera cluster only to a certain extent.

It may happen that there’s no need for a third datacenter because, let’s say, your application is located in only two of them. Of course, the requirement of three datacenters is still valid so you won’t go around it, but it is perfectly fine to use a Galera Arbitrator (garbd) instead of fully loaded database servers.

Garbd can be installed on smaller nodes, even virtual servers. It does not require powerful hardware, it does not store any data nor apply any of the writesets. But it does see all the replication traffic, and takes part in the quorum calculation. Thanks to it, you can deploy setups like four nodes, two per DC + garbd in the third one - you have five nodes in total, and such cluster can accept up to two failures. So it means it can accept a full shutdown of one of the datacenters.

Which option is better for you? There is no best solution for all cases, it all depends on your infrastructure requirements. Luckily, there are different options to pick from: more or less nodes, full 3 DC or 2 DC and garbd in the third one - it’s quite likely you’ll find something suitable for you.

Network latency

When working with multi-DC setups, you have to keep in mind that network latency will be significantly higher than what you’d expect from a local network environment. This may seriously reduce performance of the Galera cluster when you compare it with standalone MySQL instance or a MySQL replication setup. The requirement that all of the nodes have to certify a writeset means that all of the nodes have to receive it, no matter how far away they are. With asynchronous replication, there’s no need to wait before a commit. Of course, replication has other issues and drawbacks, but latency is not the major one. The problem is especially visible when your database has hot spots - rows, which are frequently updated (counters, queues, etc). Those rows cannot be updated more often than once per network round trip. For clusters spanning across the globe, this can easily mean that you won’t be able to update a single row more often than 2 - 3 times per second. If this becomes a limitation for you, it may mean that Galera cluster is not a good fit for your particular workload.

Proxy layer in multi-DC Galera cluster

It’s not enough to have Galera cluster spanning across multiple datacenters, you still need your application to access them. One of the popular methods to hide complexity of the database layer from an application is to utilize a proxy. Proxies are used as an entry point to the databases, they track the state of the database nodes and should always direct traffic to only the nodes that are available. In this section, we’ll try to propose a proxy layer design which could be used for a multi-DC Galera cluster. We’ll use ProxySQL, which gives you quite a bit of flexibility in handling database nodes, but you can use another proxy, as long as it can track the state of Galera nodes.

Where to locate the proxies?

In short, there are two common patterns here: you can either deploy ProxySQL on a separate nodes or you can deploy them on the application hosts. Let’s take a look at pros and cons of each of these setups.

Proxy layer as a separate set of hosts

The first pattern is to build a proxy layer using separate, dedicated hosts. You can deploy ProxySQL on a couple of hosts, and use Virtual IP and keepalived to maintain high availability. An application will use the VIP to connect to the database, and the VIP will ensure that requests will always be routed to an available ProxySQL. The main issue with this setup is that you use at most one of the ProxySQL instances - all standby nodes are not used for routing the traffic. This may force you to use more powerful hardware than you’d typically use. On the other hand, it is easier to maintain the setup - you will have to apply configuration changes on all of the ProxySQL nodes, but there will be just a handful of them. You can also utilize ClusterControl’s option to sync the nodes. Such setup will have to be duplicated on every datacenter that you use.

Proxy installed on application instances

Instead of having a separate set of hosts, ProxySQL can also be installed on the application hosts. Application will connect directly to the ProxySQL on localhost, it could even use unix socket to minimize the overhead of the TCP connection. The main advantage of such a setup is that you have a large number of ProxySQL instances, and the load is evenly distributed across them. If one goes down, only that application host will be affected. The remaining nodes will continue to work. The most serious issue to face is configuration management. With a large number of ProxySQL nodes, it is crucial to come up with an automated method of keeping their configurations in sync. You could use ClusterControl, or a configuration management tool like Puppet.

Tuning of Galera in a WAN environment

Galera defaults are designed for local network and if you want to use it in a WAN environment, some tuning is required. Let’s discuss some of the basic tweaks you can make. Please keep in mind that the precise tuning requires production data and traffic - you can’t just make some changes and assume they are good, you should do proper benchmarking.

Operating system configuration

Let’s start with the operating system configuration. Not all of the modifications proposed here are WAN-related, but it’s always good to remind ourselves what is a good starting point for any MySQL installation.

vm.swappiness = 1

Swappiness controls how aggressive the operating system will use swap. It should not be set to zero because in more recent kernels, it prevents the OS from using swap at all and it may cause serious performance issues.

/sys/block/*/queue/scheduler = deadline/noop

The scheduler for the block device, which MySQL uses, should be set to either deadline or noop. The exact choice depends on the benchmarks but both settings should deliver similar performance, better than default scheduler, CFQ.

For MySQL, you should consider using EXT4 or XFS, depending on the kernel (performance of those filesystems changes from one kernel version to another). Perform some benchmarks to find the better option for you.

In addition to this, you may want to look into sysctl network settings. We will not discuss them in detail (you can find documentation here) but the general idea is to increase buffers, backlogs and timeouts, to make it easier to accommodate for stalls and unstable WAN link.

net.core.optmem_max = 40960
net.core.rmem_max = 16777216
net.core.wmem_max = 16777216
net.core.rmem_default = 16777216
net.core.wmem_default = 16777216
net.ipv4.tcp_rmem = 4096 87380 16777216
net.ipv4.tcp_wmem = 4096 87380 16777216
net.core.netdev_max_backlog = 50000
net.ipv4.tcp_max_syn_backlog = 30000
net.ipv4.tcp_congestion_control = htcp
net.ipv4.tcp_mtu_probing = 1
net.ipv4.tcp_max_tw_buckets = 2000000
net.ipv4.tcp_tw_reuse = 1
net.ipv4.tcp_fin_timeout = 30
net.ipv4.tcp_slow_start_after_idle = 0

In addition to OS tuning you should consider tweaking Galera network - related settings.

evs.suspect_timeout
evs.inactive_timeout

You may want to consider changing the default values of these variables. Both timeouts govern how the cluster evicts failed nodes. Suspect timeout takes place when all of the nodes cannot reach the inactive member. Inactive timeout defines a hard limit of how long a node can stay in the cluster if it’s not responding. Usually you’ll find that the default values work well. But in some cases, especially if you run your Galera cluster over WAN (for example, between AWS regions), increasing those variables may result in more stable performance. We’d suggest to set both of them to PT1M, to make it less likely that WAN link instability will throw a node out of the cluster.

evs.send_window
evs.user_send_window

These variables, evs.send_window and evs.user_send_window, define how many packets can be sent via replication at the same time (evs.send_window) and how many of them may contain data (evs.user_send_window). For high latency connections, it may be worth increasing those values significantly (512 or 1024 for example).

evs.inactive_check_period

The above variable may also be changed. evs.inactive_check_period, by default, is set to one second, which may be too often for a WAN setup. We’d suggest to set it to PT30S.

gcs.fc_factor
gcs.fc_limit

Here we want to minimize chances that flow control will kick in, therefore we’d suggest to set gcs.fc_factor to 1 and increase gcs.fc_limit to, for example, 260.

gcs.max_packet_size

As we are working with the WAN link, where latency is significantly higher, we want to increase size of the packets. A good starting point would be 2097152.

As we mentioned earlier, it is virtually impossible to give a simple recipe on how to set these parameters as it depends on too many factors - you will have to do your own benchmarks, using data as close to your production data as possible, before you can say your system is tuned. Having said that, those settings should give you a starting point for the more precise tuning.

That’s it for now. Galera works pretty well in WAN environments, so do give it a try and let us know how you get on.

Manage and Automate Galera Cluster - Why ClusterControl

$
0
0

Galera Cluster by Codership is a synchronous multi-master replication technology which can be utilized to build highly available MySQL or MariaDB clusters.

It has been downloaded over one million times since last year, establishing itself as one of the most popular high availability and scalability technologies for MySQL, MariaDB and Percona Server with database users worldwide.

And while Galera Cluster is easy enough to deploy, it is complex to operate. To properly automate and manage it does require a sound understanding of how it works and how it behaves in production. For instance, once it’s deployed, how does it behave under a real-life workload, scale, and during long term operations?

This is where monitoring performance and optimizing it, understanding anomalies, recovering from failures, managing schema and configuration changes and pushing them in production, version upgrades and performing backups come into play.

There are a number of things you’d want to have thought through and be in control of before going in production with Galera Cluster for MySQL or MariaDB:

  • Hardware and network requirements
  • OS tuning
  • Sane configuration settings for the database
  • Production-grade deployment
  • Security
  • Monitoring and alerting
  • Query performance
  • Anomaly detection and troubleshooting
  • Recovering from failures
  • Schema changes
  • Backup strategies and disaster recovery
  • Disaster recovery
  • Reporting and analytics
  • Capacity planning

And the list goes on ...

We saw great potential in Galera Cluster early on, and started building a deployment and management product for it even before the first 1.0 version was released. We are happy to see that the technology has delivered on its promises - high availability of MySQL with good write scalability. Over the years, we have been able to build out comprehensive management procedures in ClusterControl and battle-test these across thousands of installations.

Not everyone has the knowledge, skills, time or resources to manage a high availability database. It is hard enough to find a production DBA, or a DevOps person with strong database knowledge. So imagine that most of the relevant steps in that process could be automated and managed from one central system?

This is where ClusterControl comes in.

ClusterControl
Single Console for Your Entire Database Infrastructure
Find out what else is new in ClusterControl

ClusterControl is our all-inclusive database management system that lets you easily deploy, monitor, manage and scale highly available open source databases on-premise or in the cloud.

So Why Use ClusterControl for Galera Cluster?

Deploying a production ready Galera Cluster has become a matter of a few clicks for ClusterControl users worldwide. And with tens of thousands of deployments to date, it’s safe to say that ClusterControl is truly ‘Galera battle-tested’. We’ve included years of industry best practices into the product to help companies automate and manage their database operations as smoothly as possible.

Some of the key benefits of using ClusterControl with Galera Cluster include:

  • Maximum efficiency: automated failure detection, failover, and automatic recovery of individual nodes or even entire clusters to achieve
  • Pro-active intelligence: gain access to advanced monitoring features that give you insights into your database performance and alert you to any problems right away
  • Advanced security: ClusterControl provides an array of advanced security features that you can depend on to keep your data safe

One of our most trusted users put it this way:

“In Severalnines we found a partner that is much more than a perfect database management system provider with ClusterControl: we have a partner that helps us define the architectures of our LAMP projects and leverage the capabilities of Galera Cluster.”

- Olivier Lenormand, Technical Manager, CNRS/DSI.

Customers include Cisco, British Telecom, Orange, Ping Identity, Cisco, Liberty Global, AVG and many others.

The following are some of the key features to be found in ClusterControl for Galera Cluster:

  • Deploy Database Clusters
  • Configuration Management
  • Full stack monitoring (DB/LB/Host)
  • Query Monitoring
  • Anomaly detection
  • Failure detection and automatic recovery/repair
  • Add Node, Load Balancer (HAProxy, ProxySQL, MaxScale) or asynchronous replication slave
  • Backup Management
  • Encryption of data in transit
  • Online rolling upgrades
  • Developer Studio with Advisors

For a general introduction to ClusterControl, view the following video:

And for a demonstration of the ClusterControl features for Galera Cluster, view the following demo video:

To summarise, working seamlessly with your Galera setup, ClusterControl provides an integrated monitoring and troubleshooting approach, speeding up problem resolutions. A single interface saves you time by not having to cobble together configuration management tools, monitoring tools, scripts, etc. to operate your databases. And you can maximize efficiency and reduce database downtime with battle-tested automated recovery features.

Finally, ClusterControl fully supports all three Galera Cluster flavours, so you can easily deploy different clusters and compare them yourself with your own workload, on your own hardware. Do give it a try.

[Updated] Monitoring Galera Cluster for MySQL or MariaDB - Understanding metrics and their meaning

$
0
0

To operate any database efficiently, you need to have insight into database performance. This might not be obvious when everything is going well, but as soon as something goes wrong, access to information can be instrumental in quickly and correctly diagnosing the problem.

All databases make some of their internal status data available to users. In MySQL, you can get this data mostly by running 'SHOW STATUS' and 'SHOW GLOBAL STATUS', by executing 'SHOW ENGINE INNODB STATUS', checking information_schema tables and, in newer versions, by querying performance_schema tables.

These methods are far from convenient in day-to-day operations, hence the popularity of different monitoring and trending solutions. Tools like Nagios/Icinga are designed to watch hosts/services, and alert when a service falls outside an acceptable range. Other tools such as Cacti and Munin provide a graphical look at host/service information, and give historical context to performance and usage. ClusterControl combines these two types of monitoring, so we’ll have a look at the information it presents, and how we should interpret it.

If you’re using Galera Cluster (MySQL Galera Cluster by Codership or MariaDB Cluster or Percona XtraDB Cluster), you may have noticed the following section in ClusterControl’s "Overview" tab:

Let’s see, step by step, what kind of data we have here.

The first column contains the list of nodes with their IP addresses - there’s not much else to say about it.

Second column is more interesting - it describes node status (wsrep_local_state_comment status). A node can be in different states:

  • Initialized - The node is up and running, but it’s not a part of a cluster. It can be caused, for example, by network issues;
  • Joining - The node is in the process of joining the cluster and it’s either receiving or requesting a state transfer from one of other nodes;
  • Donor/Desynced - The node serves as a donor to some other node which is joining the cluster;
  • Joined - The node is joined the cluster but its busy catching up on committed write sets;
  • Synced - The node is working normally.

In the same column within the bracket is the cluster status (wsrep_cluster_status status). It can have three distinct states:

  • Primary - The communication between nodes is working and quorum is present (majority of nodes is available)
  • Non-Primary - The node was a part of the cluster but, for some reason, it lost contact with the rest of the cluster. As a result, this node is considered inactive and it won’t accept queries
  • Disconnected - The node could not establish group communication.

"WSREP Cluster Size / Ready" tells us about a cluster size as the node sees it, and whether the node is ready to accept queries. Non-Primary components create a cluster with size of 1 and wsrep readiness is OFF.

Let’s take a look at the screenshot above, and see what it is telling us about Galera. We can see three nodes. Two of them (192.168.55.171 and 192.168.55.173) are perfectly fine, they are both "Synced" and the cluster is in "Primary" state. The cluster currently consists of two nodes. Node 192.168.55.172 is "Initialized" and it forms "non-Primary" component. It means that this node lost connection with the cluster - most likely some kind of network issues (in fact, we used iptables to block a traffic to this node from both 192.168.55.171 and 192.168.55.173).

At this moment we have to stop a bit and describe how Galera Cluster works internally. We’ll not go into too much details as it is not within a scope of this blog post but some knowledge is required to understand the importance of the data presented in next columns.

Galera is a "virtually" synchronous, multi-master cluster. It means that you should expect data to be transferred across nodes "virtually" at the same time (no more annoying issues with lagging slaves) and that you can write to any node in a cluster (no more annoying issues with promoting a slave to master). To accomplish that, Galera uses writesets - atomic set of changes that are replicated across the cluster. A writeset can contain several row changes and additional needed information like data regarding locking.

Once a client issues COMMIT, but before MySQL actually commits anything, a writeset is created and sent to all nodes in the cluster for certification. All nodes check whether it’s possible to commit the changes or not (as changes may interfere with other writes executed, in the meantime, directly on another node). If yes, data is actually committed by MySQL, if not, rollback is executed.

What’s important to remember is the fact that nodes, similar to slaves in regular replication, may perform differently - some may have better hardware than others, some may be more loaded than others. Yet Galera requires them to process the writesets in a short and quick manner, in order to maintain "virtual" synchronization. There has to be a mechanism which can throttle the replication and allow slower nodes to keep up with the rest of the cluster.

Let's take a look at "Local Send Q [now/avg]" and "Local Receive Q [now/avg]" columns. Each node has a local queue for sending and receiving writesets. It allows to parallelize some of the writes and queue data which couldn’t be processed at once if node cannot keep up with traffic. In SHOW GLOBAL STATUS we can find eight counters describing both queues, four counters per queue:

  • wsrep_local_send_queue - current state of the send queue
  • wsrep_local_send_queue_min - minimum since FLUSH STATUS
  • wsrep_local_send_queue_max - maximum since FLUSH STATUS
  • wsrep_local_send_queue_avg - average since FLUSH STATUS
  • wsrep_local_recv_queue - current state of the receive queue
  • wsrep_local_recv_queue_min - minimum since FLUSH STATUS
  • wsrep_local_recv_queue_max - maximum since FLUSH STATUS
  • wsrep_local_recv_queue_avg - average since FLUSH STATUS

The above metrics are unified across nodes under ClusterControl -> Performance -> DB Status:

ClusterControl displays "now" and "average" counters, as they are the most meaningful as a single number (you can also create custom graphs based on variables describing the current state of the queues) . When we see that one of the queues is rising, this means that the node can’t keep up with the replication and other nodes will have to slow down to allow it to catch up. We’d recommend to investigate a workload of that given node - check the process list for some long running queries, check OS statistics like CPU utilization and I/O workload. Maybe it’s also possible to redistribute some of the traffic from that node to the rest of the cluster.

"Flow Control Paused" shows information about the percentage of time a given node had to pause its replication because of too heavy load. When a node can’t keep up with the workload it sends Flow Control packets to other nodes, informing them they should throttle down on sending writesets. In our screenshot, we have value of ‘0.30’ for node 192.168.55.172. This means that almost 30% of the time this node had to pause the replication because it wasn’t able to keep up with writeset certification rate required by other nodes (or simpler, too many writes hit it!). As we can see, it’s "Local Receive Q [avg]" points us also to this fact.

Next column, "Flow Control Sent" gives us information about how many Flow Control packets a given node sent to the cluster. Again, we see that it’s node 192.168.55.172 which is slowing down the cluster.

What can we do with this information? Mostly, we should investigate what’s going on in the slow node. Check CPU utilization, check I/O performance and network stats. This first step helps to assess what kind of problem we are facing.

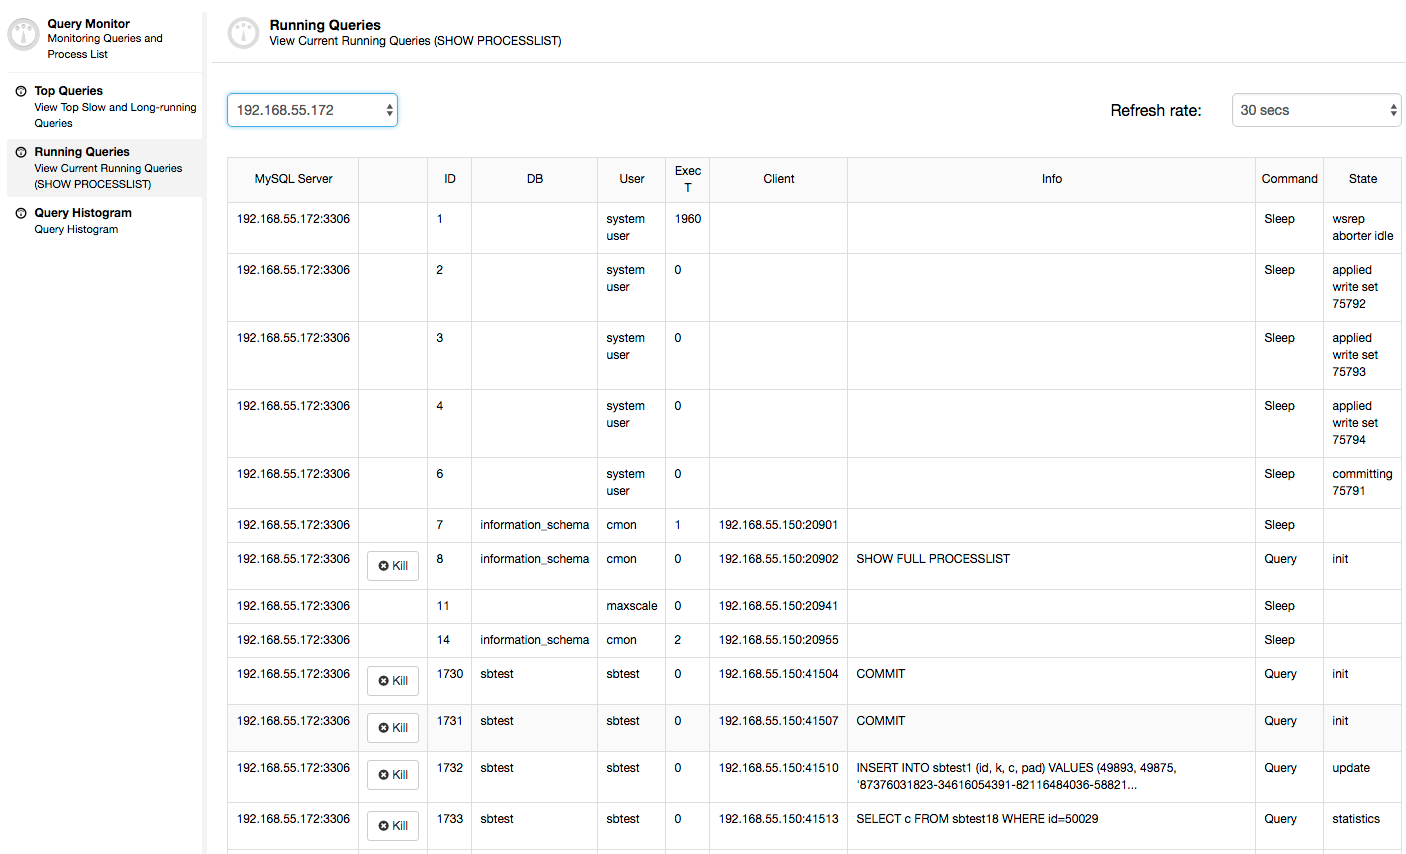
In this case, once we switch to CPU Usage tab, it becomes clear that extensive CPU utilization is causing our issues. Next step would be to identify the culprit by looking into PROCESSLIST (Query Monitor -> Running Queries -> filter by 192.168.55.172) to check for offending queries:

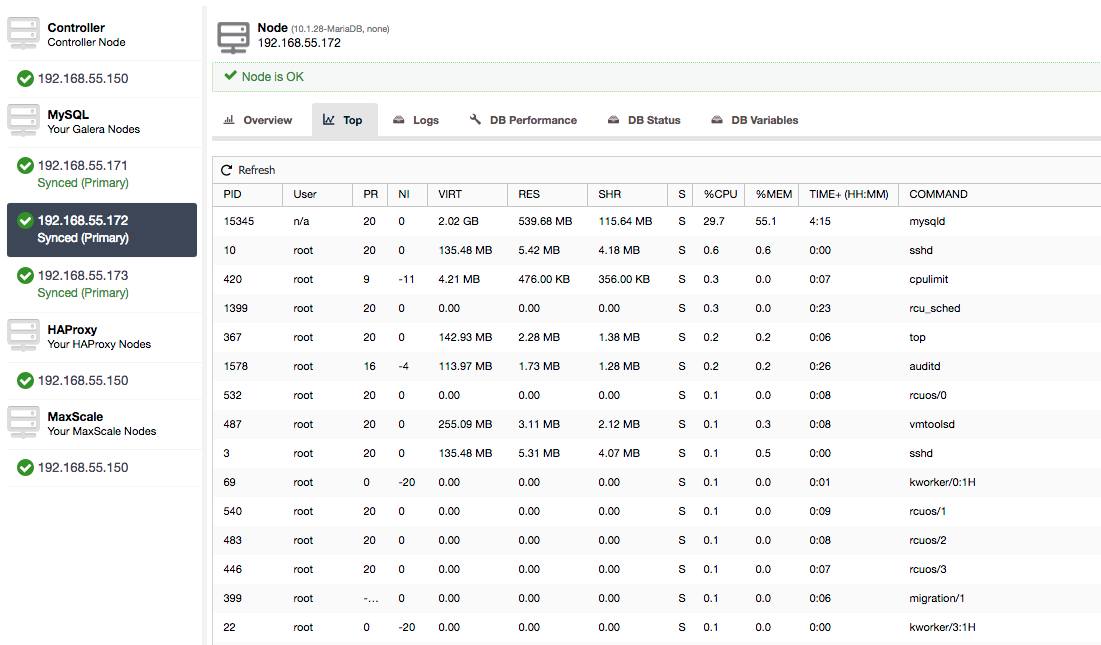
Or, check processes on the node from operating system’s side (Nodes -> 192.168.55.172 -> Top) to see if the load is not caused by something outside of Galera/MySQL.

In this case, we have executed mysqld command through cpulimit, to simulate slow CPU usage specifically for mysqld process by limiting it to 30% out of 400% available CPU (the server has 4 cores).

"Cert Deps Distance" column gives us information about how many writesets, on average, can be applied in parallel. Writesets can, sometimes, be executed at the same time - Galera takes advantage of this by using multiple wsrep_slave_threads to apply writesets. This column gives you some idea how many slave threads you could use on your workload. It’s worth noting that there’s no point in setting up wsrep_slave_threads variable to values higher than you see in this column or in wsrep_cert_deps_distance status variable, on which "Cert Deps Distance" column is based. Another important note - there is no point either in setting wsrep_slave_threads variable to more than number of cores your CPU has.

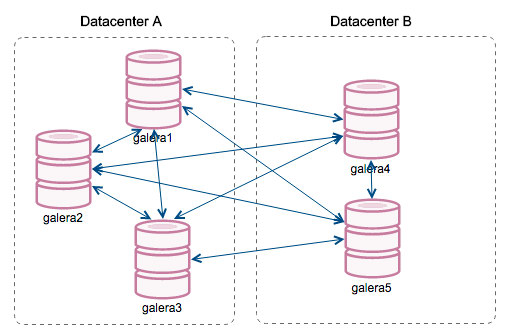
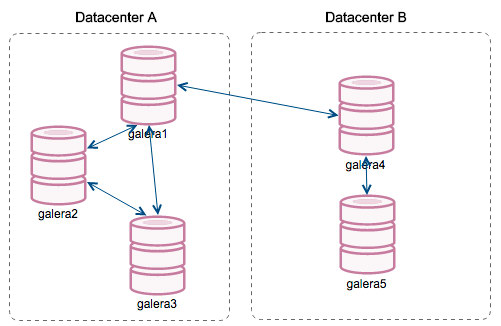
"Segment ID" - this column will require some more explanation. Segments are a new feature added in Galera 3.0. Before this version, writesets were exchanged between all nodes. Let’s say we have two datacenters:

This kind of chatter works ok on local networks but WAN is a different story - certification slows down due to increased latency, additional costs are generated because of network bandwidth used for transferring writesets between every member of the cluster.

With the introduction of "Segments", things changed. You can assign a node to a segment by modifying wsrep_provider_options variable and adding "gmcast.segment=x" (0, 1, 2) to it. Nodes with the same segment number are treated as they are in the same datacenter, connected by local network. Our graph then becomes different:

The main difference is that it’s no more everyone to everyone communication. Within each segment, yes - it’s still the same mechanism but both segments communicate only through a single connection between two chosen nodes. In case of downtime, this connection will failover automatically. As a result, we get less network chatter and less bandwidth usage between remote datacenters. So, basically, "Segment ID" column tells us to which segment a node is assigned.

"Last Committed" column gives us information about the sequence number of the writeset that was last executed on a given node. It can be useful in determining which node is the most current one if there’s a need to bootstrap the cluster.

Rest of the columns are self-explanatory: Server version, uptime of a node and when the status was updated.

As you can see, the "Galera Nodes" section of the "Nodes/Hosts Stats" in the "Overview" tab gives you a pretty good understanding of the cluster’s health - whether it forms a "Primary" component, how many nodes are healthy, are there any performance issues with some nodes and if yes, which node is slowing down the cluster.

This set of data comes in very handy when you operate your Galera cluster, so hopefully, no more flying blind :-)

The Galera Cluster & Severalnines Teams Present: How to Manage Galera Cluster with ClusterControl

$
0
0

Join us on November 14th 2017 as we combine forces with the Codership Galera Cluster Team to talk about how to manage Galera Cluster using ClusterControl!

Galera Cluster has become one of the most popular high availability solution for MySQL and MariaDB; and ClusterControl is the de facto automation and management system for Galera Cluster.

We’ll be joined by Seppo Jaakola, CEO of Codership - Galera Cluster, and together, we’ll demonstrate what it is that makes Galera Cluster such a popular high availability solution for MySQL and MariaDB and how to best manage it with ClusterControl.

We’ll discuss the latest features of Galera Cluster with Seppo, one of the creators of Galera Cluster. We’ll also demo how to automate it all from deployment, monitoring, backups, failover, recovery, rolling upgrades and scaling using the new ClusterControl CLI.

Sign up below!

Date, Time & Registration

Europe/MEA/APAC

Tuesday, November 14th at 09:00 GMT / 10:00 CET (Germany, France, Sweden)

Register Now

North America/LatAm

Tuesday, November 14th at 09:00 PT (US) / 12:00 ET (US)

Register Now

Agenda

  • Introduction
    • About Codership, the makers of Galera Cluster
    • About Severalnines, the makers of ClusterControl
  • What’s new with Galera Cluster
    • Core feature set overview
    • The latest features
    • What’s coming up
  • ClusterControl for Galera Cluster
    • Deployment
    • Monitoring
    • Management
    • Scaling
  • Live Demo
  • Q&A

Speakers

Seppo Jaakola, Founder of Codership, has over 20 years experience in software engineering. He started his professional career in Digisoft and Novo Group Oy working as a software engineer in various technical projects. He then worked for 10 years in Stonesoft Oy as a Project Manager in projects dealing with DBMS development, data security and firewall clustering. In 2003, Seppo Jaakola joined Continuent Oy, where he worked as team leader for MySQL clustering product. This position linked together his earlier experience in DBMS research and distributed computing. Now he’s applying his years of experience and administrative skills to steer Codership to a right course. Seppo Jaakola has MSc degree in Software Engineering from Helsinki University of Technology.

Krzysztof Książek, Senior Support Engineer at Severalnines, is a MySQL DBA with experience managing complex database environments for companies like Zendesk, Chegg, Pinterest and Flipboard.


Comparing Oracle RAC HA Solution to Galera Cluster for MySQL or MariaDB

$
0
0

Business has continuously desired to derive insights from information to make reliable, smarter, real-time, fact-based decisions. As firms rely more on data and databases, information and data processing is the core of many business operations and business decisions. The faith in the database is total. None of the day-to-day company services can run without the underlying database platforms. As a consequence, the necessity on scalability and performance of database system software is more critical than ever. The principal benefits of the clustered database system are scalability and high availability. In this blog, we will try to compare Oracle RAC and Galera Cluster in the light of these two aspects. Real Application Clusters (RAC) is Oracle’s premium solution to clustering Oracle databases and provides High Availability and Scalability. Galera Cluster is the most popular clustering technology for MySQL and MariaDB.

Architecture overview

Oracle RAC uses Oracle Clusterware software to bind multiple servers. Oracle Clusterware is a cluster management solution that is integrated with Oracle Database, but it can also be used with other services, not only the database. The Oracle Clusterware is an additional software installed on servers running the same operating system, which lets the servers to be chained together to operate as if they were one server.

Oracle Clusterware watches the instance and automatically restarts it if a crash occurs. If your application is well designed, you may not experience any service interruption. Only a group of sessions (those connected to the failed instance) is affected by the failure. The blackout can be efficiently masked to the end user using advanced RAC features like Fast Application Notification and the Oracle client’s Fast Connection Failover. Oracle Clusterware controls node membership and prevents split brain symptoms in which two or more instances attempt to control the instance.

Galera Cluster is a synchronous active-active database clustering technology for MySQL and MariaDB. Galera Cluster differs from what is known as Oracle’s MySQL Cluster - NDB. MariaDB cluster is based on the multi-master replication plugin provided by Codership. Since version 5.5, the Galera plugin (wsrep API) is an integral part of MariaDB. Percona XtraDB Cluster (PXC) is also based on the Galera plugin. The Galera plugin architecture stands on three core layers: certification, replication, and group communication framework. Certification layer prepares the write-sets and does the certification checks on them, guaranteeing that they can be applied. Replication layer manages the replication protocol and provides the total ordering capability. Group Communication Framework implements a plugin architecture which allows other systems to connect via gcomm back-end schema.

To keep the state identical across the cluster, the wsrep API uses a Global Transaction ID. GTID unique identifier is created and associated with each transaction committed on the database node. In Oracle RAC, various database instances share access to resources such as data blocks in the buffer cache to enqueue data blocks. Access to the shared resources between RAC instances needs to be coordinated to avoid conflict. To organize shared access to these resources, the distributed cache maintains information such as data block ID, which RAC instance holds the current version of this data block, and the lock mode in which each instance contains the data block.

Data storage key concepts

Oracle RAC relies on a distributed disk architecture. The database files, control files and online redo logs for the database need be accessible to each node in the cluster. There is a variation of ways to configure shared storage including directly attached disks, Storage Area Networks (SAN), and Network Attached Storage (NAS) and Oracle ASM. Two most popular are OCFS and ASM. Oracle Cluster File System (OCFS) is a shared file system designed specifically for Oracle RAC. OCFS eliminates the requirement that Oracle database files be connected to logical drives and enables all nodes to share a single Oracle Home ASM, RAW Device. Oracle ASM is Oracle's advised storage management solution that provides an alternative to conventional volume managers, file systems, and raw devices. The Oracle ASM provides a virtualization layer between the database and storage. It treats multiple disks as a single disk group and lets you dynamically add or remove drives while maintaining databases online.

There is no need to build sophisticated shared disk storage for Galera, as each node has its full copy of data. However it is a good practice to make the storage reliable with battery-backed write caches.

Oracle RAC, Cluster storage
Galera replication, disks attached to database nodes

Cluster nodes communication and cache

Oracle Real Application Clusters has a shared cache architecture, it utilizes Oracle Grid Infrastructure to enable the sharing of server and storage resources. Communication between nodes is the critical aspect of cluster integrity. Each node must have at least two network adapters or network interface cards: one for the public network interface, and one for the interconnect. Each cluster node is connected to all other nodes via a private high-speed network, also recognized as the cluster interconnect.

Oracle RAC, network architecture

The private network is typically formed with Gigabit Ethernet, but for high-volume environments, many vendors offer low-latency, high-bandwidth solutions designed for Oracle RAC. Linux also extends a means of bonding multiple physical NICs into a single virtual NIC to provide increased bandwidth and availability.

While the default approach to connecting Galera nodes is to use a single NIC per host, you can have more than one card. ClusterControl can assist you with such setup. The main difference is the bandwidth requirement on the interconnect. Oracle RAC ships blocks of data between instances, so it places a heavier load on the interconnect as compared to Galera write-sets (which consist of a list of operations).

With Redundant Interconnect Usage in RAC, you can identify multiple interfaces to use for the private cluster network, without the need of using bonding or other technologies. This functionality is available starting with Oracle Database 11gR2. If you use the Oracle Clusterware excessive interconnect feature, then you must use IPv4 addresses for the interfaces (UDP is a default).

To manage high availability, each cluster node is assigned a virtual IP address (VIP). In the event of node failure, the failed node's IP address can be reassigned to a surviving node to allow applications continue to reach the database through the same IP address.

Sophisticated network setup is necessary to Oracle's Cache Fusion technology to couple the physical memory in each host into a single cache. Oracle Cache Fusion provides data stored in the cache of one Oracle instance to be accessed by any other instance by transporting it across the private network. It also protects data integrity and cache coherency by transmitting locking and supplementary synchronization information beyond cluster nodes.

On top of the described network setup, you can set a single database address for your application - Single Client Access Name (SCAN). The primary purpose of SCAN is to provide ease of connection management. For instance, you can add new nodes to the cluster without changing your client connection string. This functionality is because Oracle will automatically distribute requests accordingly based on the SCAN IPs which point to the underlying VIPs. Scan listeners do the bridge between clients and the underlying local listeners which are VIP-dependent.

For Galera Cluster, the equivalent of SCAN would be adding a database proxy in front of the Galera nodes. The proxy would be a single point of contact for applications, it can blacklist failed nodes and route queries to healthy nodes. The proxy itself can be made redundant with Keepalived and Virtual IP.

ClusterControl
Single Console for Your Entire Database Infrastructure
Find out what else is new in ClusterControl

Failover and data recovery

The main difference between Oracle RAC and MySQL Galera Cluster is that Galera is shared nothing architecture. Instead of shared disks, Galera uses certification based replication with group communication and transaction ordering to achieve synchronous replication. A database cluster should be able to survive a loss of a node, although it's achieved in different ways. In case of Galera, the critical aspect is the number of nodes, Galera requires a quorum to stay operational. A three node cluster can survive the crash of one node. With more nodes in your cluster, your availability will grow. Oracle RAC doesn't require a quorum to stay operational after a node crash. It is because of the access to distributed storage that keeps consistent information about cluster state. However, your data storage could be a potential point of failure in your high availability plan. While it's reasonably straightforward task to have Galera cluster nodes spread across geolocation data centers, it wouldn't be that easy with RAC. Oracle RAC requires additional high-end disk mirroring however, basic RAID like redundancy can be achieved inside an ASM diskgroup.

Disk Group TypeSupported Mirroring LevelsDefault Mirroring Level
External redundancyUnprotected (none)Unprotected
Normal redundancyTwo-way, three-way, unprotected (none)Two-way
High redundancyThree-wayThree-way
Flex redundancyTwo-way, three-way, unprotected (none)Two-way (newly-created)
Extended redundancyTwo-way, three-way, unprotected (none)Two-way
ASM Disk Group redundancy

Locking Schemes

In a single-user database, a user can alter data without concern for other sessions modifying the same data at the same time. However, in a multi-user database multi-node environment, this become more tricky. A multi-user database must provide the following:

  • data concurrency - the assurance that users can access data at the same time,
  • data consistency - the assurance that each user sees a consistent view of the data.

Cluster instances require three main types of concurrency locking:

  • Data concurrency reads on different instances,
  • Data concurrency reads and writes on different instances,
  • Data concurrency writes on different instances.

Oracle lets you choose the policy for locking, either pessimistic or optimistic, depending on your requirements. To obtain concurrency locking, RAC has two additional buffers. They are Global Cache Service (GCS) and Global Enqueue Service (GES). These two services cover the Cache Fusion process, resource transfers, and resource escalations among the instances. GES include cache locks, dictionary locks, transaction locks and table locks. GCS maintains the block modes and block transfers between the instances.

In Galera cluster, each node has its storage and buffers. When a transaction is started, database resources local to that node are involved. At commit, the operations that are part of that transaction are broadcasted as part of a write-set, to the rest of the group. Since all nodes have the same state, the write-set will either be successful on all nodes or it will fail on all nodes.

Galera Cluster uses at the cluster-level optimistic concurrency control, which can appear in transactions that result in a COMMIT aborting. The first commit wins. When aborts occur at the cluster level, Galera Cluster gives a deadlock error. This may or may not impact your application architecture. High number of rows to replicate in a single transaction would impact node responses, although there are techniques to avoid such behavior.

Hardware & Software requirements

Configuring both clusters hardware doesn’t require potent resources. Minimal Oracle RAC cluster configuration would be satisfied by two servers with two CPUs, physical memory at least 1.5 GB of RAM, an amount of swap space equal to the amount of RAM and two Gigabit Ethernet NICs. Galera’s minimum node configuration is three nodes (one of nodes can be an arbitrator, gardb), each with 1GHz single-core CPU 512MB RAM, 100 Mbps network card. While these are the minimal, we can safely say that in both cases you would probably like to have more resources for your production system.

Each node stores software so you would need to prepare several gigabytes of your storage. Oracle and Galera both have the ability to individually patch the nodes by taking them down one at a time. This rolling patch avoids a complete application outage as there are always database nodes available to handle traffic.

What is important to mention is that a production Galera cluster can easily run on VM’s or basic bare metal, while RAC would need investment in sophisticated shared storage and fiber communication.

Monitoring and management

Oracle Enterprise Manager is the favored approach for monitoring Oracle RAC and Oracle Clusterware. Oracle Enterprise Manager is an Oracle Web-based unified management system for monitoring and administering your database environment. It’s part of Oracle Enterprise License and should be installed on separate server. Cluster control monitoring and management is done via combination on crsctl and srvctl commands which are part of cluster binaries. Below you can find a couple of example commands.

Clusterware Resource Status Check:

    crsctl status resource -t (or shorter: crsctl stat res -t)

Example:

$ crsctl stat res ora.test1.vip
NAME=ora.test1.vip
TYPE=ora.cluster_vip_net1.type
TARGET=ONLINE
STATE=ONLINE on test1

Check the status of the Oracle Clusterware stack:

    crsctl check cluster

Example:

$ crsctl check cluster -all
*****************************************************************
node1:
CRS-4537: Cluster Ready Services is online
CRS-4529: Cluster Synchronization Services is online
CRS-4533: Event Manager is online
*****************************************************************
node2:
CRS-4537: Cluster Ready Services is online
CRS-4529: Cluster Synchronization Services is online
CRS-4533: Event Manager is online

Check the status of Oracle High Availability Services and the Oracle Clusterware stack on the local server:

    crsctl check crs

Example:

$ crsctl check crs
CRS-4638: Oracle High Availablity Services is online
CRS-4537: Cluster Ready Services is online
CRS-4529: Cluster Synchronization Services is online
CRS-4533: Event Manager is online

Stop Oracle High Availability Services on the local server.

    crsctl stop has

Stop Oracle High Availability Services on the local server.

    crsctl start has

Displays the status of node applications:

    srvctl status nodeapps

Displays the configuration information for all SCAN VIPs

    srvctl config scan

Example:

srvctl config scan -scannumber 1
SCAN name: testscan, Network: 1
Subnet IPv4: 192.51.100.1/203.0.113.46/eth0, static
Subnet IPv6: 
SCAN 1 IPv4 VIP: 192.51.100.195
SCAN VIP is enabled.
SCAN VIP is individually enabled on nodes:
SCAN VIP is individually disabled on nodes:

The Cluster Verification Utility (CVU) performs system checks in preparation for installation, patch updates, or other system changes:

    cluvfy comp ocr

Example:

Verifying OCR integrity
Checking OCR integrity...
Checking the absence of a non-clustered configurationl...
All nodes free of non-clustered, local-only configurations
ASM Running check passed. ASM is running on all specified nodes
Checking OCR config file “/etc/oracle/ocr.loc"...
OCR config file “/etc/oracle/ocr.loc" check successful
Disk group for ocr location “+DATA" available on all the nodes
NOTE:
This check does not verify the integrity of the OCR contents. Execute ‘ocrcheck' as a privileged user to verify the contents of OCR.
OCR integrity check passed
Verification of OCR integrity was successful.

Galera nodes and the cluster requires the wsrep API to report several statuses, which is exposed. There are currently 34 dedicated status variables can be viewed with SHOW STATUS statement.

mysql> SHOW STATUS LIKE 'wsrep_%';
wsrep_apply_oooe
wsrep_apply_oool
wsrep_cert_deps_distance
wsrep_cluster_conf_id
wsrep_cluster_size
wsrep_cluster_state_uuid
wsrep_cluster_status
wsrep_connected
wsrep_flow_control_paused
wsrep_flow_control_paused_ns
wsrep_flow_control_recv
wsrep_local_send_queue_avg
wsrep_local_state_uuid
wsrep_protocol_version
wsrep_provider_name
wsrep_provider_vendor
wsrep_provider_version
wsrep_flow_control_sent
wsrep_gcomm_uuid
wsrep_last_committed
wsrep_local_bf_aborts
wsrep_local_cert_failures
wsrep_local_commits
wsrep_local_index
wsrep_local_recv_queue
wsrep_local_recv_queue_avg
wsrep_local_replays
wsrep_local_send_queue
wsrep_ready
wsrep_received
wsrep_received_bytes
wsrep_replicated
wsrep_replicated_bytes
wsrep_thread_count

The administration of MySQL Galera Cluster in many aspects is very similar. There are just few exceptions like bootstrapping the cluster from initial node or recovering nodes via SST or IST operations.

Bootstrapping cluster:

$ service mysql bootstrap # sysvinit
$ service mysql start --wsrep-new-cluster # sysvinit
$ galera_new_cluster # systemd
$ mysqld_safe --wsrep-new-cluster # command line

The equivalent Web-based, out of the box solution to manage and monitor Galera Cluster is ClusterControl. It provides a web-based interface to deploy clusters, monitors key metrics, provides database advisors, and take care of management tasks like backup and restore, automatic patching, traffic encryption and availability management.

Restrictions on workload

Oracle provides SCAN technology which we found missing in Galera Cluster. The benefit of SCAN is that the client’s connection information does not need to change if you add or remove nodes or databases in the cluster. When using SCAN, the Oracle database randomly connects to one of the available SCAN listeners (typically three) in a round robin fashion and balances the connections between them. Two kinds load balancing can be configured: client side, connect time load balancing and on the server side, run time load balancing. Although there is nothing similar within Galera cluster itself, the same functionality can be addressed with additional software like ProxySQL, HAProxy, Maxscale combined with Keepalived.

When it comes to application workload design for Galera Cluster, you should avoid conflicting updates on the same row, as it leads to deadlocks across the cluster. Avoid bulk inserts or updates, as these might be larger than the maximum allowed writeset. That might also cause cluster stalls.

Designing Oracle HA with RAC you need to keep in mind that RAC only protects against server failure, and you need to mirror the storage and have network redundancy. Modern web applications require access to location-independent data services, and because of RAC’s storage architecture limitations, it can be tricky to achieve. You also need to spend a notable amount of time to gain relevant knowledge to manage the environment; it is a long process. On the application workload side, there are some drawbacks. Distributing separated read or write operations on the same dataset is not optimal because latency is added by supplementary internode data exchange. Things like partitioning, sequence cache, and sorting operations should be reviewed before migrating to RAC.

Multi data-center redundancy

According to the Oracle documentation, the maximum distance between two boxes connected in a point-to-point fashion and running synchronously can be only 10 km. Using specialized devices, this distance can be increased to 100 km.

Galera Cluster is well known for its multi-datacenter replication capabilities. It has rich support for Wider Area Networks network settings. It can be configured for high network latency by taking Round-Trip Time (RTT) measurements between cluster nodes and adjusting necessary parameters. The wsrep_provider_options parameters allow you to configure settings like suspect_timeout, interactive_timeout, join_retrans_timouts and many more.

Using Galera and RAC in Cloud

Per Oracle note www.oracle.com/technetwork/database/options/.../rac-cloud-support-2843861.pdf no third-party cloud currently meets Oracle’s requirements regarding natively provided shared storage. “Native” in this context means that the cloud provider must support shared storage as part of their infrastructure as per Oracle’s support policy.

Thanks to its shared nothing architecture, which is not tied to a sophisticated storage solution, Galera cluster can be easily deployed in a cloud environment. Things like:

  • optimized network protocol,
  • topology-aware replication,
  • traffic encryption,
  • detection and automatic eviction of unreliable nodes,

makes cloud migration process more reliable.

Licenses and hidden costs

Oracle licensing is a complex topic and would require a separate blog article. The cluster factor makes it even more difficult. The cost goes up as we have to add some options to license a complete RAC solution. Here we just want to highlight what to expect and where to find more information.

RAC is a feature of Oracle Enterprise Edition license. Oracle Enterprise license is split into two types, per named user and per processor. If you consider Enterprise Edition with per core license, then the single core cost is RAC 23,000 USD + Oracle DB EE 47,500 USD, and you still need to add a ~ 22% support fee. We would like to refer to a great blog on pricing found on https://flashdba.com/2013/09/18/the-real-cost-of-oracle-rac/.

Flashdba calculated the price of a four node Oracle RAC. The total amount was 902,400 USD plus additional 595,584 USD for three years DB maintenance, and that does not include features like partitioning or in-memory database, all that with 60% Oracle discount.

Galera Cluster is an open source solution that anyone can run for free. Subscriptions are available for production implementations that require vendor support. A good TCO calculation can be found at https://severalnines.com/blog/database-tco-calculating-total-cost-ownership-mysql-management.

Conclusion

While there are significant differences in architecture, both clusters share the main principles and can achieve similar goals. Oracle enterprise product comes with everything out of the box (and it's price). With a cost in the range of >1M USD as seen above, it is a high-end solution that many enterprises would not be able to afford. Galera Cluster can be described as a decent high availability solution for the masses. In certain cases, Galera may well be a very good alternative to Oracle RAC. One drawback is that you have to build your own stack, although that can be completely automated with ClusterControl. We’d love to hear your thoughts on this.

Watch the Replay: How to Migrate to Galera Cluster for MySQL & MariaDB

$
0
0

Watch the replay of this webinar with Severalnines Support Engineer Bart Oles, as he walks us through what you need to know in order to migrate from standalone or a master-slave MySQL/MariaDB setup to Galera Cluster.

When considering such a migration, plenty of questions typically come up, such as: how do we migrate? Does the schema or application change? What are the limitations? Can a migration be done online, without service interruption? What are the potential risks?

Galera Cluster has become a mainstream option for high availability MySQL and MariaDB. And though it is now known as a credible replacement for traditional MySQL master-slave architectures, it is not a drop-in replacement.

It has some characteristics that make it unsuitable for certain use cases, however, most applications can still be adapted to run on it.

The benefits are clear: multi-master InnoDB setup with built-in failover and read scalability.

Check out this walk-through on how to migrate to Galera Cluster for MySQL and MariaDB.

Watch the replay and browse through the slides!

Agenda

  • Application use cases for Galera
  • Schema design
  • Events and Triggers
  • Query design
  • Migrating the schema
  • Load balancer and VIP
  • Loading initial data into the cluster
  • Limitations:
    • Cluster technology
    • Application vendor support
  • Performing Online Migration to Galera
  • Operational management checklist
  • Belts and suspenders: Plan B
  • Demo

Speaker

Bartlomiej Oles is a MySQL and Oracle DBA, with over 15 years experience in managing highly available production systems at IBM, Nordea Bank, Acxiom, Lufthansa, and other Fortune 500 companies. In the past five years, his focus has been on building and applying automation tools to manage multi-datacenter database environments.

How to Recover MySQL Galera Cluster from an Asynchronous Slave?

$
0
0

Introduction

When running Galera Cluster, it is a common practice to add one or more asynchronous slaves in the same or in a different datacenter. This provides us with a contingency plan with low RTO, and with a low operating cost. In the case of an unrecoverable problem in our cluster, we can quickly failover to it so applications can continue to have access to data.

When using this type of setup, we cannot just then rebuild our cluster from a previous backup. Since the async slave is now the new source of truth, we need to rebuild the cluster from it.

This does not mean that we only have one way to do it, maybe there is even a better way! Feel free to give us your suggestions in the comments section at the end of this post.

Topology

ClusterControl Topology View Online

Above, we can see a sample topology with Galera Cluster and an asynchronous replica/slave.

Database Diagram 1
Database Diagram 1

Next we will see how we can recreate our cluster, starting from the slave, in the case of finding something like this:

Database Diagram 2
Database Diagram 2
ClusterControl Topology View Offline

If we look at the previous image, we can see our 3 Galera nodes are down. Our slave is not able to connect to the Galera master, but it is in an "Up and running" state.

Promote slave

As our slave is working properly, we can promote it to master and point our applications to it. For this, we must disable the read-only parameter in our slave and reset the slave configuration.

In our slave (mysql1):

mysql> SET GLOBAL read_only=0;
Query OK, 0 rows affected (0.00 sec)
mysql> STOP SLAVE;
Query OK, 0 rows affected (0.00 sec)
mysql> RESET SLAVE;
Query OK, 0 rows affected (0.18 sec)

Create new cluster

Next, to start recovery of our failed cluster, we will create a new Galera Cluster. This can be easily done through ClusterControl ClusterControl, please scroll further down in this blog to see how.

Once we have deployed our new Galera cluster, we would have something like the following:

Database Diagram 3
Database Diagram 3

Replication

We must ensure that we have the replication parameters configured.

For Galera nodes (galera1, galera2, galera3):

server_id=<ID>         # Different value in each node
binlog_format=ROW
log_bin = /var/lib/mysql-binlog/binlog
log_slave_updates = ON
gtid_mode = ON
enforce_gtid_consistency = true
relay_log = relay-bin
expire_logs_days = 7

For Master node (mysql1):

server_id=<ID>         # Different value in each node
binlog_format=ROW
log_bin=binlog
log_slave_updates=1
gtid_mode=ON
enforce_gtid_consistency=1
relay_log=relay-bin
expire_logs_days=7
read_only=ON
sync_binlog=1
report_host=<HOSTNAME or IP>    # Local server

In order for our new slave (galera1) to connect with our new master (mysql1), we must create a user with replication permissions in our master.

In our new master (mysql1):

mysql> GRANT REPLICATION SLAVE ON *.* TO 'slave_user'@'%' IDENTIFIED BY 'slave_password';

Note: We can replace the "%" with the IP of the Galera Cluster node that will be our slave, in our example, galera1.

Backup

If we do not have it, we must create a consistent backup of our master (mysql1) and load it in our new Galera Cluster. For this, we can use XtraBackup tool or mysqldump. Let’s see both options.

In our example we use the sakila database available for testing.

XtraBackup tool

We generate the backup in the new master (mysql1). In our case we send it to the local directory /root/backup:

$ innobackupex /root/backup/

We must get the message:

180705 22:08:14 completed OK!

We compress the backup and send it to the node that will be our slave (galera1):

$ cd /root/backup
$ tar zcvf 2018-07-05_22-08-07.tar.gz 2018-07-05_22-08-07
$ scp /root/backup/2018-07-05_22-08-07.tar.gz galera1:/root/backup/

In galera1, extract the backup:

$ tar zxvf /root/backup/2018-07-05_22-08-07.tar.gz

We stop the cluster (if it is started). For this we stop the mysql services of the 3 nodes:

$ service mysql stop

In galera1, we rename the data directory of mysql and load the backup:

$ mv /var/lib/mysql /var/lib/mysql.bak
$ innobackupex --copy-back /root/backup/2018-07-05_22-08-07

We must get the message:

180705 23:00:01 completed OK!

We assign the correct permissions on the data directory:

$ chown -R mysql.mysql /var/lib/mysql

Then we must initialize the cluster.

Once the first node is initialized, we must start the MySQL service for the remaining nodes, eliminating any previous copy of the file grastate.dat, and then verify that our data is updated.

$ rm /var/lib/mysql/grastate.dat
$ service mysql start

Note: Verify that the user used by XtraBackup is created in our initialized node, and is the same in each node.

mysqldump

In general, we do not recommend doing it with mysqldump, because it can be quite slow with a large volume of data. But it is an alternative to perform the task.

We generate the backup in the new master (mysql1):

$ mysqldump -uroot -p --single-transaction --skip-add-locks --triggers --routines --events --databases sakila > /root/backup/sakila_dump.sql

We compress it and send it to our slave node (galera1):

$ gzip /root/backup/sakila_dump.sql
$ scp /root/backup/sakila_dump.sql.gz galera1:/root/backup/

We load the dump into galera1.

$ gunzip /root/backup/sakila_dump.sql.gz
$ mysql -p < /root/backup/sakila_dump.sql

When the dump is loaded in galera1, we must restart the MySQL service on the remaining nodes, removing the file grastate.dat, and verify that we have our data updated.

$ rm /var/lib/mysql/grastate.dat
$ service mysql start

Start replication slave

Regardless of which option we choose, XtraBackup or mysqldump, if everything went well, in this step we can already turn on replication in the node that will be our slave (galera1).

$ mysql> CHANGE MASTER TO MASTER_HOST = 'mysql1', MASTER_PORT = 3306, MASTER_USER = 'slave_user', MASTER_PASSWORD = 'slave_password', MASTER_AUTO_POSITION = 1;
$ mysql> START SLAVE;

We verify that the slave is working:

mysql> SHOW SLAVE STATUS\G
       Slave_IO_Running: Yes
       Slave_SQL_Running: Yes

At this point, we have something like the following:

Database Diagram 4
Database Diagram 4

After NewGalera1 is up to date, we can re-point the application to our new galera cluster, and reconfigure the asynchronous replication.

ClusterControl

As we mentioned earlier, with ClusterControl we can do several of the tasks mentioned above in a few simple clicks. It also has automatic recovery options, for both the nodes and the cluster. Let's see some tasks that it can assist with.

ClusterControl Deployment 1

To perform a deployment, simply select the option “Deploy Database Cluster” and follow the instructions that appear.

ClusterControl Deployment 2

We can choose between different kinds of technologies and vendors. We must specify User, Key or Password and port to connect by SSH to our servers. We also need the name for our new cluster and if we want ClusterControl to install the corresponding software and configurations for us.

ClusterControl Deployment 3

After setting up the SSH access information, we must define the nodes in our cluster. We can also specify which repository to use. We need to add our servers to the cluster that we are going to create.

We can monitor the status of the creation of our new cluster from the ClusterControl activity monitor.

Also, we can do an import of our current cluster or database following the same steps. In this case, ClusterControl won’t install the database software, because there is already a database running.

ClusterControl Add Replication Salve

To add a replication slave, you need to click on Cluster Actions, select Add Replication Slave, and add the SSH access information of the new server. ClusterControl will connect to the server to make the necessary configurations for this action.

ClusterControl Enable Binary Logging

To turn one or more Galera nodes into master servers (as in the sense of producing binlogs), you can go to Node Actions and select Enable Binary Logging.

ClusterControl Backups

Backups can be configured with XtraBackup (full or incremental) and mysqldump, and you have other options like upload the backup to the cloud, encryption, compression, schedule and more.

ClusterControl Restore

To restore the backup, go to Backup tab and choose Restore option, then you select in what server you want to restore.

ClusterControl Change Replication Master

If you have a slave and you want to change the master, or rebuild the replication, you can go to Node Actions and select the option.

Conclusion

As we could see, we have several ways to achieve our goal, some more complex, others more user friendly, but with any of them you can recreate a cluster from an asynchronous slave. Xtrabackup would restore faster for larger data volumes. To guard against operator error (e.g., an erroneous DROP TABLE), you could also use a delayed slave so you hopefully have time to stop the statement from propagating.

We hope that this information is useful, and that you never have to use it in production ;)

Galera Cluster Recovery 101 - A Deep Dive into Network Partitioning

$
0
0

One of the cool features in Galera is automatic node provisioning and membership control. If a node fails or loses communication, it will be automatically evicted from the cluster and remain unoperational. As long as the majority of nodes are still communicating (Galera calls this PC - primary component), there is a very high chance the failed node would be able to automatically rejoin, resync and resume the replication once the connectivity is back.

Generally, all Galera nodes are equal. They hold the same data set and same role as masters, capable of handling read and write simultaneously, thanks to Galera group communication and certification-based replication plugin. Therefore, there is actually no failover from the database point-of-view due to this equilibrium. Only from the application side that would require failover, to skip the unoperational nodes while the cluster is partitioned.

In this blog post, we are going to look into understanding how Galera Cluster performs node and cluster recovery in case network partition happens. Just as a side note, we have covered a similar topic in this blog post some time back. Codership has explained Galera's recovery concept in great details in the documentation page, Node Failure and Recovery.

Node Failure and Eviction

In order to understand the recovery, we have to understand how Galera detects the node failure and eviction process first. Let's put this into a controlled test scenario so we can understand the eviction process better. Suppose we have a three-node Galera Cluster as illustrated below:

The following command can be used to retrieve our Galera provider options:

mysql> SHOW VARIABLES LIKE 'wsrep_provider_options'\G

It's a long list, but we just need to focus on some of the parameters to explain the process:

evs.inactive_check_period = PT0.5S; 
evs.inactive_timeout = PT15S; 
evs.keepalive_period = PT1S; 
evs.suspect_timeout = PT5S; 
evs.view_forget_timeout = P1D;
gmcast.peer_timeout = PT3S;

First of all, Galera follows ISO 8601 formatting to represent duration. P1D means the duration is one day, while PT15S means the duration is 15 seconds (note the time designator, T, that precedes the time value). For example if one wanted to increase evs.view_forget_timeout to 1 day and a half, one would set P1DT12H, or PT36H.

Considering all hosts haven't been configured with any firewall rules, we use the following script called block_galera.sh on galera2 to simulate a network failure to/from this node:

#!/bin/bash
# block_galera.sh
# galera2, 192.168.55.172

iptables -I INPUT -m tcp -p tcp --dport 4567 -j REJECT
iptables -I INPUT -m tcp -p tcp --dport 3306 -j REJECT
iptables -I OUTPUT -m tcp -p tcp --dport 4567 -j REJECT
iptables -I OUTPUT -m tcp -p tcp --dport 3306 -j REJECT
# print timestamp
date

By executing the script, we get the following output:

$ ./block_galera.sh
Wed Jul  4 16:46:02 UTC 2018

The reported timestamp can be considered as the start of the cluster partitioning, where we lose galera2, while galera1 and galera3 are still online and accessible. At this point, our Galera Cluster architecture is looking something like this:

From Partitioned Node Perspective

On galera2, you will see some printouts inside the MySQL error log. Let's break them out into several parts. The downtime was started around 16:46:02 UTC time and after gmcast.peer_timeout=PT3S, the following appears:

2018-07-04 16:46:05 140454904243968 [Note] WSREP: (62116b35, 'tcp://0.0.0.0:4567') connection to peer 8b2041d6 with addr tcp://192.168.55.173:4567 timed out, no messages seen in PT3S
2018-07-04 16:46:05 140454904243968 [Note] WSREP: (62116b35, 'tcp://0.0.0.0:4567') turning message relay requesting on, nonlive peers: tcp://192.168.55.173:4567
2018-07-04 16:46:06 140454904243968 [Note] WSREP: (62116b35, 'tcp://0.0.0.0:4567') connection to peer 737422d6 with addr tcp://192.168.55.171:4567 timed out, no messages seen in PT3S
2018-07-04 16:46:06 140454904243968 [Note] WSREP: (62116b35, 'tcp://0.0.0.0:4567') reconnecting to 8b2041d6 (tcp://192.168.55.173:4567), attempt 0

As it passed evs.suspect_timeout = PT5S, both nodes galera1 and galera3 are suspected as dead by galera2:

2018-07-04 16:46:07 140454904243968 [Note] WSREP: evs::proto(62116b35, OPERATIONAL, view_id(REG,62116b35,54)) suspecting node: 8b2041d6
2018-07-04 16:46:07 140454904243968 [Note] WSREP: evs::proto(62116b35, OPERATIONAL, view_id(REG,62116b35,54)) suspected node without join message, declaring inactive
2018-07-04 16:46:07 140454904243968 [Note] WSREP: (62116b35, 'tcp://0.0.0.0:4567') reconnecting to 737422d6 (tcp://192.168.55.171:4567), attempt 0
2018-07-04 16:46:08 140454904243968 [Note] WSREP: evs::proto(62116b35, GATHER, view_id(REG,62116b35,54)) suspecting node: 737422d6
2018-07-04 16:46:08 140454904243968 [Note] WSREP: evs::proto(62116b35, GATHER, view_id(REG,62116b35,54)) suspected node without join message, declaring inactive

Then, Galera will revise the current cluster view and the position of this node:

2018-07-04 16:46:09 140454904243968 [Note] WSREP: view(view_id(NON_PRIM,62116b35,54) memb {
        62116b35,0
} joined {
} left {
} partitioned {
        737422d6,0
        8b2041d6,0
})
2018-07-04 16:46:09 140454904243968 [Note] WSREP: view(view_id(NON_PRIM,62116b35,55) memb {
        62116b35,0
} joined {
} left {
} partitioned {
        737422d6,0
        8b2041d6,0
})

With the new cluster view, Galera will perform quorum calculation to decide whether this node is part of the primary component. If the new component sees "primary = no", Galera will demote the local node state from SYNCED to OPEN:

2018-07-04 16:46:09 140454288942848 [Note] WSREP: New COMPONENT: primary = no, bootstrap = no, my_idx = 0, memb_num = 1
2018-07-04 16:46:09 140454288942848 [Note] WSREP: Flow-control interval: [16, 16]
2018-07-04 16:46:09 140454288942848 [Note] WSREP: Trying to continue unpaused monitor
2018-07-04 16:46:09 140454288942848 [Note] WSREP: Received NON-PRIMARY.
2018-07-04 16:46:09 140454288942848 [Note] WSREP: Shifting SYNCED -> OPEN (TO: 2753699)

With the latest change on the cluster view and node state, Galera returns the post-eviction cluster view and global state as below:

2018-07-04 16:46:09 140454222194432 [Note] WSREP: New cluster view: global state: 55238f52-41ee-11e8-852f-3316bdb654bc:2753699, view# -1: non-Primary, number of nodes: 1, my index: 0, protocol version 3
2018-07-04 16:46:09 140454222194432 [Note] WSREP: wsrep_notify_cmd is not defined, skipping notification.

You can see the following global status of galera2 have changed during this period:

mysql> SELECT * FROM information_schema.global_status WHERE variable_name IN ('WSREP_CLUSTER_STATUS','WSREP_LOCAL_STATE_COMMENT','WSREP_CLUSTER_SIZE','WSREP_EVS_DELAYED','WSREP_READY');
+---------------------------+-----------------------------------------------------------------------------------------------------------------------------------+
| VARIABLE_NAME             | VARIABLE_VALUE                                                                                                                    |
+---------------------------+-----------------------------------------------------------------------------------------------------------------------------------+
| WSREP_CLUSTER_SIZE        | 1                                                                                                                                 |
| WSREP_CLUSTER_STATUS      | non-Primary                                                                                                                       |
| WSREP_EVS_DELAYED         | 737422d6-7db3-11e8-a2a2-bbe98913baf0:tcp://192.168.55.171:4567:1,8b2041d6-7f62-11e8-87d5-12a76678131f:tcp://192.168.55.173:4567:2 |
| WSREP_LOCAL_STATE_COMMENT | Initialized                                                                                                                       |
| WSREP_READY               | OFF                                                                                                                               |
+---------------------------+-----------------------------------------------------------------------------------------------------------------------------------+

At this point, MySQL/MariaDB server on galera2 is still accessible (database is listening on 3306 and Galera on 4567) and you can query the mysql system tables and list out the databases and tables. However when you jump into the non-system tables and make a simple query like this:

mysql> SELECT * FROM sbtest1;
ERROR 1047 (08S01): WSREP has not yet prepared node for application use

You will immediately get an error indicating WSREP is loaded but not ready to use by this node, as reported by wsrep_ready status. This is due to the node losing its connection to the Primary Component and it enters the non-operational state (the local node status was changed from SYNCED to OPEN). Data reads from nodes in a non-operational state are considered stale, unless you set wsrep_dirty_reads=ON to permit reads, although Galera still rejects any command that modifies or updates the database.

Finally, Galera will keep on listening and reconnecting to other members in the background infinitely:

2018-07-04 16:47:12 140454904243968 [Note] WSREP: (62116b35, 'tcp://0.0.0.0:4567') reconnecting to 8b2041d6 (tcp://192.168.55.173:4567), attempt 30
2018-07-04 16:47:13 140454904243968 [Note] WSREP: (62116b35, 'tcp://0.0.0.0:4567') reconnecting to 737422d6 (tcp://192.168.55.171:4567), attempt 30
2018-07-04 16:48:20 140454904243968 [Note] WSREP: (62116b35, 'tcp://0.0.0.0:4567') reconnecting to 8b2041d6 (tcp://192.168.55.173:4567), attempt 60
2018-07-04 16:48:22 140454904243968 [Note] WSREP: (62116b35, 'tcp://0.0.0.0:4567') reconnecting to 737422d6 (tcp://192.168.55.171:4567), attempt 60

The eviction process flow by Galera group communication for the partitioned node during network issue can be summarized as below:

  1. Disconnects from the cluster after gmcast.peer_timeout.
  2. Suspects other nodes after evs.suspect_timeout.
  3. Retrieves the new cluster view.
  4. Performs quorum calculation to determine the node's state.
  5. Demotes the node from SYNCED to OPEN.
  6. Attempts to reconnect to the primary component (other Galera nodes) in the background.

From Primary Component Perspective

On galera1 and galera3 respectively, after gmcast.peer_timeout=PT3S, the following appears in the MySQL error log:

2018-07-04 16:46:05 139955510687488 [Note] WSREP: (8b2041d6, 'tcp://0.0.0.0:4567') turning message relay requesting on, nonlive peers: tcp://192.168.55.172:4567
2018-07-04 16:46:06 139955510687488 [Note] WSREP: (8b2041d6, 'tcp://0.0.0.0:4567') reconnecting to 62116b35 (tcp://192.168.55.172:4567), attempt 0

After it passed evs.suspect_timeout = PT5S, galera2 is suspected as dead by galera3 (and galera1):

2018-07-04 16:46:10 139955510687488 [Note] WSREP: evs::proto(8b2041d6, OPERATIONAL, view_id(REG,62116b35,54)) suspecting node: 62116b35
2018-07-04 16:46:10 139955510687488 [Note] WSREP: evs::proto(8b2041d6, OPERATIONAL, view_id(REG,62116b35,54)) suspected node without join message, declaring inactive

Galera checks out if the other nodes respond to the group communication on galera3, it finds galera1 is in primary and stable state:

2018-07-04 16:46:11 139955510687488 [Note] WSREP: declaring 737422d6 at tcp://192.168.55.171:4567 stable
2018-07-04 16:46:11 139955510687488 [Note] WSREP: Node 737422d6 state prim

Galera revises the cluster view of this node (galera3):

2018-07-04 16:46:11 139955510687488 [Note] WSREP: view(view_id(PRIM,737422d6,55) memb {
        737422d6,0
        8b2041d6,0
} joined {
} left {
} partitioned {
        62116b35,0
})
2018-07-04 16:46:11 139955510687488 [Note] WSREP: save pc into disk

Galera then removes the partitioned node from the Primary Component:

2018-07-04 16:46:11 139955510687488 [Note] WSREP: forgetting 62116b35 (tcp://192.168.55.172:4567)

The new Primary Component is now consisted of two nodes, galera1 and galera3:

2018-07-04 16:46:11 139955502294784 [Note] WSREP: New COMPONENT: primary = yes, bootstrap = no, my_idx = 1, memb_num = 2

The Primary Component will exchange the state between each other to agree on the new cluster view and global state:

2018-07-04 16:46:11 139955502294784 [Note] WSREP: STATE EXCHANGE: Waiting for state UUID.
2018-07-04 16:46:11 139955510687488 [Note] WSREP: (8b2041d6, 'tcp://0.0.0.0:4567') turning message relay requesting off
2018-07-04 16:46:11 139955502294784 [Note] WSREP: STATE EXCHANGE: sent state msg: b3d38100-7f66-11e8-8e70-8e3bf680c993
2018-07-04 16:46:11 139955502294784 [Note] WSREP: STATE EXCHANGE: got state msg: b3d38100-7f66-11e8-8e70-8e3bf680c993 from 0 (192.168.55.171)
2018-07-04 16:46:11 139955502294784 [Note] WSREP: STATE EXCHANGE: got state msg: b3d38100-7f66-11e8-8e70-8e3bf680c993 from 1 (192.168.55.173)

Galera calculates and verifies the quorum of the state exchange between online members:

2018-07-04 16:46:11 139955502294784 [Note] WSREP: Quorum results:
        version    = 4,
        component  = PRIMARY,
        conf_id    = 27,
        members    = 2/2 (joined/total),
        act_id     = 2753703,
        last_appl. = 2753606,
        protocols  = 0/8/3 (gcs/repl/appl),
        group UUID = 55238f52-41ee-11e8-852f-3316bdb654bc
2018-07-04 16:46:11 139955502294784 [Note] WSREP: Flow-control interval: [23, 23]
2018-07-04 16:46:11 139955502294784 [Note] WSREP: Trying to continue unpaused monitor

Galera updates the new cluster view and global state after galera2 eviction:

2018-07-04 16:46:11 139955214169856 [Note] WSREP: New cluster view: global state: 55238f52-41ee-11e8-852f-3316bdb654bc:2753703, view# 28: Primary, number of nodes: 2, my index: 1, protocol version 3
2018-07-04 16:46:11 139955214169856 [Note] WSREP: wsrep_notify_cmd is not defined, skipping notification.
2018-07-04 16:46:11 139955214169856 [Note] WSREP: REPL Protocols: 8 (3, 2)
2018-07-04 16:46:11 139955214169856 [Note] WSREP: Assign initial position for certification: 2753703, protocol version: 3
2018-07-04 16:46:11 139956691814144 [Note] WSREP: Service thread queue flushed.
Clean up the partitioned node (galera2) from the active list:
2018-07-04 16:46:14 139955510687488 [Note] WSREP: cleaning up 62116b35 (tcp://192.168.55.172:4567)

At this point, both galera1 and galera3 will be reporting similar global status:

mysql> SELECT * FROM information_schema.global_status WHERE variable_name IN ('WSREP_CLUSTER_STATUS','WSREP_LOCAL_STATE_COMMENT','WSREP_CLUSTER_SIZE','WSREP_EVS_DELAYED','WSREP_READY');
+---------------------------+------------------------------------------------------------------+
| VARIABLE_NAME             | VARIABLE_VALUE                                                   |
+---------------------------+------------------------------------------------------------------+
| WSREP_CLUSTER_SIZE        | 2                                                                |
| WSREP_CLUSTER_STATUS      | Primary                                                          |
| WSREP_EVS_DELAYED         | 1491abd9-7f6d-11e8-8930-e269b03673d8:tcp://192.168.55.172:4567:1 |
| WSREP_LOCAL_STATE_COMMENT | Synced                                                           |
| WSREP_READY               | ON                                                               |
+---------------------------+------------------------------------------------------------------+

They list out the problematic member in the wsrep_evs_delayed status. Since the local state is "Synced", these nodes are operational and you can redirect the client connections from galera2 to any of them. If this step is inconvenient, consider using a load balancer sitting in front of the database to simplify the connection endpoint from the clients.

Node Recovery and Joining

A partitioned Galera node will keep on attempting to establish connection with the Primary Component infinitely. Let's flush the iptables rules on galera2 to let it connect with the remaining nodes:

# on galera2
$ iptables -F

Once the node is capable of connecting to one of the nodes, Galera will start re-establishing the group communication automatically:

2018-07-09 10:46:34 140075962705664 [Note] WSREP: (1491abd9, 'tcp://0.0.0.0:4567') connection established to 8b2041d6 tcp://192.168.55.173:4567
2018-07-09 10:46:34 140075962705664 [Note] WSREP: (1491abd9, 'tcp://0.0.0.0:4567') connection established to 737422d6 tcp://192.168.55.171:4567
2018-07-09 10:46:34 140075962705664 [Note] WSREP: declaring 737422d6 at tcp://192.168.55.171:4567 stable
2018-07-09 10:46:34 140075962705664 [Note] WSREP: declaring 8b2041d6 at tcp://192.168.55.173:4567 stable

Node galera2 will then connect to one of the Primary Component (in this case is galera1, node ID 737422d6) to get the current cluster view and nodes state:

2018-07-09 10:46:34 140075962705664 [Note] WSREP: Node 737422d6 state prim
2018-07-09 10:46:34 140075962705664 [Note] WSREP: view(view_id(PRIM,1491abd9,142) memb {
        1491abd9,0
        737422d6,0
        8b2041d6,0
} joined {
} left {
} partitioned {
})
2018-07-09 10:46:34 140075962705664 [Note] WSREP: save pc into disk

Galera will then perform state exchange with the rest of the members that can form the Primary Component:

2018-07-09 10:46:34 140075954312960 [Note] WSREP: New COMPONENT: primary = yes, bootstrap = no, my_idx = 0, memb_num = 3
2018-07-09 10:46:34 140075954312960 [Note] WSREP: STATE_EXCHANGE: sent state UUID: 4b23eaa0-8322-11e8-a87e-fe4e0fce2a5f
2018-07-09 10:46:34 140075954312960 [Note] WSREP: STATE EXCHANGE: sent state msg: 4b23eaa0-8322-11e8-a87e-fe4e0fce2a5f
2018-07-09 10:46:34 140075954312960 [Note] WSREP: STATE EXCHANGE: got state msg: 4b23eaa0-8322-11e8-a87e-fe4e0fce2a5f from 0 (192.168.55.172)
2018-07-09 10:46:34 140075954312960 [Note] WSREP: STATE EXCHANGE: got state msg: 4b23eaa0-8322-11e8-a87e-fe4e0fce2a5f from 1 (192.168.55.171)
2018-07-09 10:46:34 140075954312960 [Note] WSREP: STATE EXCHANGE: got state msg: 4b23eaa0-8322-11e8-a87e-fe4e0fce2a5f from 2 (192.168.55.173)

The state exchange allows galera2 to calculate the quorum and produce the following result:

2018-07-09 10:46:34 140075954312960 [Note] WSREP: Quorum results:
        version    = 4,
        component  = PRIMARY,
        conf_id    = 71,
        members    = 2/3 (joined/total),
        act_id     = 2836958,
        last_appl. = 0,
        protocols  = 0/8/3 (gcs/repl/appl),
        group UUID = 55238f52-41ee-11e8-852f-3316bdb654bc

Galera will then promote the local node state from OPEN to PRIMARY, to start and establish the node connection to the Primary Component:

2018-07-09 10:46:34 140075954312960 [Note] WSREP: Flow-control interval: [28, 28]
2018-07-09 10:46:34 140075954312960 [Note] WSREP: Trying to continue unpaused monitor
2018-07-09 10:46:34 140075954312960 [Note] WSREP: Shifting OPEN -> PRIMARY (TO: 2836958)

As reported by the above line, Galera calculates the gap on how far the node is behind from the cluster. This node requires state transfer to catch up to writeset number 2836958 from 2761994:

2018-07-09 10:46:34 140075929970432 [Note] WSREP: State transfer required:
        Group state: 55238f52-41ee-11e8-852f-3316bdb654bc:2836958
        Local state: 55238f52-41ee-11e8-852f-3316bdb654bc:2761994
2018-07-09 10:46:34 140075929970432 [Note] WSREP: New cluster view: global state: 55238f52-41ee-11e8-852f-3316bdb654bc:2836958, view# 72: Primary, number of nodes:
3, my index: 0, protocol version 3
2018-07-09 10:46:34 140075929970432 [Warning] WSREP: Gap in state sequence. Need state transfer.
2018-07-09 10:46:34 140075929970432 [Note] WSREP: wsrep_notify_cmd is not defined, skipping notification.
2018-07-09 10:46:34 140075929970432 [Note] WSREP: REPL Protocols: 8 (3, 2)
2018-07-09 10:46:34 140075929970432 [Note] WSREP: Assign initial position for certification: 2836958, protocol version: 3

Galera prepares the IST listener on port 4568 on this node and asks any Synced node in the cluster to become a donor. In this case, Galera automatically picks galera3 (192.168.55.173), or it could also pick a donor from the list under wsrep_sst_donor (if defined) for the syncing operation:

2018-07-09 10:46:34 140075996276480 [Note] WSREP: Service thread queue flushed.
2018-07-09 10:46:34 140075929970432 [Note] WSREP: IST receiver addr using tcp://192.168.55.172:4568
2018-07-09 10:46:34 140075929970432 [Note] WSREP: Prepared IST receiver, listening at: tcp://192.168.55.172:4568
2018-07-09 10:46:34 140075954312960 [Note] WSREP: Member 0.0 (192.168.55.172) requested state transfer from '*any*'. Selected 2.0 (192.168.55.173)(SYNCED) as donor.

It will then change the local node state from PRIMARY to JOINER. At this stage, galera2 is granted with state transfer request and starts to cache write-sets:

2018-07-09 10:46:34 140075954312960 [Note] WSREP: Shifting PRIMARY -> JOINER (TO: 2836958)
2018-07-09 10:46:34 140075929970432 [Note] WSREP: Requesting state transfer: success, donor: 2
2018-07-09 10:46:34 140075929970432 [Note] WSREP: GCache history reset: 55238f52-41ee-11e8-852f-3316bdb654bc:2761994 -> 55238f52-41ee-11e8-852f-3316bdb654bc:2836958
2018-07-09 10:46:34 140075929970432 [Note] WSREP: GCache DEBUG: RingBuffer::seqno_reset(): full reset

Node galera2 starts receiving the missing writesets from the selected donor's gcache (galera3):

2018-07-09 10:46:34 140075954312960 [Note] WSREP: 2.0 (192.168.55.173): State transfer to 0.0 (192.168.55.172) complete.
2018-07-09 10:46:34 140075929970432 [Note] WSREP: Receiving IST: 74964 writesets, seqnos 2761994-2836958
2018-07-09 10:46:34 140075593627392 [Note] WSREP: Receiving IST...  0.0% (    0/74964 events) complete.
2018-07-09 10:46:34 140075954312960 [Note] WSREP: Member 2.0 (192.168.55.173) synced with group.
2018-07-09 10:46:34 140075962705664 [Note] WSREP: (1491abd9, 'tcp://0.0.0.0:4567') connection established to 737422d6 tcp://192.168.55.171:4567
2018-07-09 10:46:41 140075962705664 [Note] WSREP: (1491abd9, 'tcp://0.0.0.0:4567') turning message relay requesting off
2018-07-09 10:46:44 140075593627392 [Note] WSREP: Receiving IST... 36.0% (27008/74964 events) complete.
2018-07-09 10:46:54 140075593627392 [Note] WSREP: Receiving IST... 71.6% (53696/74964 events) complete.
2018-07-09 10:47:02 140075593627392 [Note] WSREP: Receiving IST...100.0% (74964/74964 events) complete.
2018-07-09 10:47:02 140075929970432 [Note] WSREP: IST received: 55238f52-41ee-11e8-852f-3316bdb654bc:2836958
2018-07-09 10:47:02 140075954312960 [Note] WSREP: 0.0 (192.168.55.172): State transfer from 2.0 (192.168.55.173) complete.

Once all the missing writesets are received and applied, Galera will promote galera2 as JOINED until seqno 2837012:

2018-07-09 10:47:02 140075954312960 [Note] WSREP: Shifting JOINER -> JOINED (TO: 2837012)
2018-07-09 10:47:02 140075954312960 [Note] WSREP: Member 0.0 (192.168.55.172) synced with group.

The node applies any cached writesets in its slave queue and finishes catching up with the cluster. Its slave queue is now empty. Galera will promote galera2 to SYNCED, indicating the node is now operational and ready to serve clients:

2018-07-09 10:47:02 140075954312960 [Note] WSREP: Shifting JOINED -> SYNCED (TO: 2837012)
2018-07-09 10:47:02 140076605892352 [Note] WSREP: Synchronized with group, ready for connections

At this point, all nodes are back operational. You can verify by using the following statements on galera2:

mysql> SELECT * FROM information_schema.global_status WHERE variable_name IN ('WSREP_CLUSTER_STATUS','WSREP_LOCAL_STATE_COMMENT','WSREP_CLUSTER_SIZE','WSREP_EVS_DELAYED','WSREP_READY');
+---------------------------+----------------+
| VARIABLE_NAME             | VARIABLE_VALUE |
+---------------------------+----------------+
| WSREP_CLUSTER_SIZE        | 3              |
| WSREP_CLUSTER_STATUS      | Primary        |
| WSREP_EVS_DELAYED         |                |
| WSREP_LOCAL_STATE_COMMENT | Synced         |
| WSREP_READY               | ON             |
+---------------------------+----------------+

The wsrep_cluster_size reported as 3 and the cluster status is Primary, indicating galera2 is part of the Primary Component. The wsrep_evs_delayed has also been cleared and the local state is now Synced.

The recovery process flow for the partitioned node during network issue can be summarized as below:

  1. Re-establishes group communication to other nodes.
  2. Retrieves the cluster view from one of the Primary Component.
  3. Performs state exchange with the Primary Component and calculates the quorum.
  4. Changes the local node state from OPEN to PRIMARY.
  5. Calculates the gap between local node and the cluster.
  6. Changes the local node state from PRIMARY to JOINER.
  7. Prepares IST listener/receiver on port 4568.
  8. Requests state transfer via IST and picks a donor.
  9. Starts receiving and applying the missing writeset from chosen donor's gcache.
  10. Changes the local node state from JOINER to JOINED.
  11. Catches up with the cluster by applying the cached writesets in the slave queue.
  12. Changes the local node state from JOINED to SYNCED.
ClusterControl
Single Console for Your Entire Database Infrastructure
Find out what else is new in ClusterControl

Cluster Failure

A Galera Cluster is considered failed if no primary component (PC) is available. Consider a similar three-node Galera Cluster as depicted in the diagram below:

A cluster is considered operational if all nodes or majority of the nodes are online. Online means they are able to see each other through Galera's replication traffic or group communication. If no traffic is coming in and out from the node, the cluster will send a heartbeat beacon for the node to response in a timely manner. Otherwise, it will be put into the delay or suspected list according to how the node responses.

If a node goes down, let's say node C, the cluster will remain operational because node A and B are still in quorum with 2 votes out of 3 to form a primary component. You should get the following cluster state on A and B:

mysql> SHOW STATUS LIKE 'wsrep_cluster_status';
+----------------------+---------+
| Variable_name        | Value   |
+----------------------+---------+
| wsrep_cluster_status | Primary |
+----------------------+---------+

If let's say a primary switch went kaput, as illustrated in the following diagram:

At this point, every single node loses communication to each other, and the cluster state will be reported as non-Primary on all nodes (as what happened to galera2 in the previous case). Every node would calculate the quorum and find out that it is the minority (1 vote out of 3) thus losing the quorum, which means no Primary Component is formed and consequently all nodes refuse to serve any data. This is deemed as cluster failure.

Once the network issue is resolved, Galera will automatically re-establish the communication between members, exchange node's states and determine the possibility of reforming the primary component by comparing node state, UUIDs and seqnos. If the probability is there, Galera will merge the primary components as shown in the following lines:

2018-06-27  0:16:57 140203784476416 [Note] WSREP: New COMPONENT: primary = yes, bootstrap = no, my_idx = 2, memb_num = 3
2018-06-27  0:16:57 140203784476416 [Note] WSREP: STATE EXCHANGE: Waiting for state UUID.
2018-06-27  0:16:57 140203784476416 [Note] WSREP: STATE EXCHANGE: sent state msg: 5885911b-795c-11e8-8683-931c85442c7e
2018-06-27  0:16:57 140203784476416 [Note] WSREP: STATE EXCHANGE: got state msg: 5885911b-795c-11e8-8683-931c85442c7e from 0 (192.168.55.171)
2018-06-27  0:16:57 140203784476416 [Note] WSREP: STATE EXCHANGE: got state msg: 5885911b-795c-11e8-8683-931c85442c7e from 1 (192.168.55.172)
2018-06-27  0:16:57 140203784476416 [Note] WSREP: STATE EXCHANGE: got state msg: 5885911b-795c-11e8-8683-931c85442c7e from 2 (192.168.55.173)
2018-06-27  0:16:57 140203784476416 [Warning] WSREP: Quorum: No node with complete state:

        Version      : 4
        Flags        : 0x3
        Protocols    : 0 / 8 / 3
        State        : NON-PRIMARY
        Desync count : 0
        Prim state   : SYNCED
        Prim UUID    : 5224a024-791b-11e8-a0ac-8bc6118b0f96
        Prim  seqno  : 5
        First seqno  : 112714
        Last  seqno  : 112725
        Prim JOINED  : 3
        State UUID   : 5885911b-795c-11e8-8683-931c85442c7e
        Group UUID   : 55238f52-41ee-11e8-852f-3316bdb654bc
        Name         : '192.168.55.171'
        Incoming addr: '192.168.55.171:3306'

        Version      : 4
        Flags        : 0x2
        Protocols    : 0 / 8 / 3
        State        : NON-PRIMARY
        Desync count : 0
        Prim state   : SYNCED
        Prim UUID    : 5224a024-791b-11e8-a0ac-8bc6118b0f96
        Prim  seqno  : 5
        First seqno  : 112714
        Last  seqno  : 112725
        Prim JOINED  : 3
        State UUID   : 5885911b-795c-11e8-8683-931c85442c7e
        Group UUID   : 55238f52-41ee-11e8-852f-3316bdb654bc
        Name         : '192.168.55.172'
        Incoming addr: '192.168.55.172:3306'

        Version      : 4
        Flags        : 0x2
        Protocols    : 0 / 8 / 3
        State        : NON-PRIMARY
        Desync count : 0
        Prim state   : SYNCED
        Prim UUID    : 5224a024-791b-11e8-a0ac-8bc6118b0f96
        Prim  seqno  : 5
        First seqno  : 112714
        Last  seqno  : 112725
        Prim JOINED  : 3
        State UUID   : 5885911b-795c-11e8-8683-931c85442c7e
        Group UUID   : 55238f52-41ee-11e8-852f-3316bdb654bc
        Name         : '192.168.55.173'
        Incoming addr: '192.168.55.173:3306'

2018-06-27  0:16:57 140203784476416 [Note] WSREP: Full re-merge of primary 5224a024-791b-11e8-a0ac-8bc6118b0f96 found: 3 of 3.
2018-06-27  0:16:57 140203784476416 [Note] WSREP: Quorum results:
        version    = 4,
        component  = PRIMARY,
        conf_id    = 5,
        members    = 3/3 (joined/total),
        act_id     = 112725,
        last_appl. = 112722,
        protocols  = 0/8/3 (gcs/repl/appl),
        group UUID = 55238f52-41ee-11e8-852f-3316bdb654bc
2018-06-27  0:16:57 140203784476416 [Note] WSREP: Flow-control interval: [28, 28]
2018-06-27  0:16:57 140203784476416 [Note] WSREP: Trying to continue unpaused monitor
2018-06-27  0:16:57 140203784476416 [Note] WSREP: Restored state OPEN -> SYNCED (112725)
2018-06-27  0:16:57 140202564110080 [Note] WSREP: New cluster view: global state: 55238f52-41ee-11e8-852f-3316bdb654bc:112725, view# 6: Primary, number of nodes: 3, my index: 2, protocol version 3

A good indicator to know if the re-bootstrapping process is OK is by looking at the following line in the error log:

[Note] WSREP: Synchronized with group, ready for connections

ClusterControl Auto Recovery

ClusterControl comes with node and cluster automatic recovery features, because it oversees and understands the state of all nodes in the cluster. Automatic recovery is by default enabled if the cluster is deployed using ClusterControl. To enable or disable the cluster, simply clicking on the power icon in the summary bar as shown below:

Green icon means automatic recovery is turned on, while red is the opposite. You can monitor the recovery progress from the Activity -> Jobs dialog, like in this case, galera2 was totally inaccessible due to firewall blocking, thus forcing ClusterControl to report the following:

The recovery process will only be commencing after a graceful timeout (30 seconds) to give Galera node a chance to recover itself beforehand. If ClusterControl fails to recover a node or cluster, it will first pull all MySQL error logs from all accessible nodes and will raise the necessary alarms to notify the user via email or by pushing critical events to the third-party integration modules like PagerDuty, VictorOps or Slack. Manual intervention is then required. For Galera Cluster, ClusterControl will keep on trying to recover the failure until you mark the node as under maintenance, or disable the automatic recovery feature.

ClusterControl's automatic recovery is one of most favorite features as voted by our users. It helps you to take the necessary actions quickly, with a complete report on what has been attempted and recommendation steps to troubleshoot further on the issue. For users with support subscriptions, you can look for extra hands by escalating this issue to our technical support team for assistance.

Conclusion

Galera automatic node recovery and membership control are neat features to simplify the cluster management, improve the database reliability and reduce the risk of human error, as commonly haunting other open-source database replication technology like MySQL Replication, Group Replication and PostgreSQL Streaming/Logical Replication.

How to perform Schema Changes in MySQL & MariaDB in a Safe Way

$
0
0

Before you attempt to perform any schema changes on your production databases, you should make sure that you have a rock solid rollback plan; and that your change procedure has been successfully tested and validated in a separate environment. At the same time, it’s your responsibility to make sure that the change causes none or the least possible impact acceptable to the business. It’s definitely not an easy task.

In this article, we will take a look at how to perform database changes on MySQL and MariaDB in a controlled way. We will talk about some good habits in your day-to-day DBA work. We’ll focus on pre-requirements and tasks during the actual operations and problems that you may face when you deal with database schema changes. We will also talk about open source tools that may help you in the process.

Test and rollback scenarios

Backup

There are many ways to lose your data. Schema upgrade failure is one of them. Unlike application code, you can’t drop a bundle of files and declare that a new version has been successfully deployed. You also can’t just put back an older set of files to rollback your changes. Of course, you can run another SQL script to change the database again, but there are cases when the only accurate way to roll back changes is by restoring the entire database from backup.

However, what if you can’t afford to rollback your database to the latest backup, or your maintenance window is not big enough (considering system performance), so you can’t perform a full database backup before the change?

One may have a sophisticated, redundant environment, but as long as data is modified in both primary and standby locations, there is not much to do about it. Many scripts can just be run once, or the changes are impossible to undo. Most of the SQL change code falls into two groups:

  • Run once – you can’t add the same column to the table twice.
  • Impossible to undo – once you’ve dropped that column, it’s gone. You could undoubtedly restore your database, but that’s not precisely an undo.

You can tackle this problem in at least two possible ways. One would be to enable the binary log and take a backup, which is compatible with PITR. Such backup has to be full, complete and consistent. For xtrabackup, as long as it contains a full dataset, it will be PITR-compatible. For mysqldump, there is an option to make it PITR-compatible too. For smaller changes, a variation of mysqldump backup would be to take only a subset of data to change. This can be done with --where option. The backup should be part of the planned maintenance.

mysqldump -u -p --lock-all-tables --where="WHERE employee_id=100" mydb employees> backup_table_tmp_change_07132018.sql

Another possibility is to use CREATE TABLE AS SELECT.

You can store data or simple structure changes in the form of a fixed temporary table. With this approach you will get a source if you need to rollback your changes. It may be quite handy if you don’t change much data. The rollback can be done by taking data out from it. If any failures occur while copying the data to the table, it is automatically dropped and not created, so make sure that your statement creates a copy you need.

Obviously, there are some limitations too.

Because the ordering of the rows in the underlying SELECT statements cannot always be determined, CREATE TABLE ... IGNORE SELECT and CREATE TABLE ... REPLACE SELECT are flagged as unsafe for statement-based replication. Such statements produce a warning in the error log when using statement-based mode and are written to the binary log using the row-based format when using MIXED mode.

A very simple example of such method could be:

CREATE TABLE tmp_employees_change_07132018 AS SELECT * FROM employees where employee_id=100;
UPDATE employees SET salary=120000 WHERE employee_id=100;
COMMMIT;

Another interesting option may be MariaDB flashback database. When a wrong update or delete happens, and you would like to revert to a state of the database (or just a table) at a certain point in time, you may use the flashback feature.

Point-in-time rollback enables DBAs to recover data faster by rolling back transactions to a previous point in time rather than performing a restore from a backup. Based on ROW-based DML events, flashback can transform the binary log and reverse purposes. That means it can help undo given row changes fast. For instance, it can change DELETE events to INSERTs and vice versa, and it will swap WHERE and SET parts of the UPDATE events. This simple idea can dramatically speed up recovery from certain types of mistakes or disasters. For those who are familiar with the Oracle database, it’s a well known feature. The limitation of MariaDB flashback is the lack of DDL support.

Create a delayed replication slave

Since version 5.6, MySQL supports delayed replication. A slave server can lag behind the master by at least a specified amount of time. The default delay is 0 seconds. Use the MASTER_DELAY option for CHANGE MASTER TO to set the delay to N seconds:

CHANGE MASTER TO MASTER_DELAY = N;

It would be a good option if you didn’t have time to prepare a proper recovery scenario. You need to have enough delay to notice the problematic change. The advantage of this approach is that you don’t need to restore your database to take out data needed to fix your change. Standby DB is up and running, ready to pick up data which minimizes the time needed.

Create an asynchronous slave which is not part of the cluster

When it comes to Galera cluster, testing changes is not easy. All nodes run the same data, and heavy load can harm flow control. So you not only need to check if changes applied successfully, but also what the impact to the cluster state was. To make your test procedure as close as possible to the production workload, you may want to add an asynchronous slave to your cluster and run your test there. The test will not impact synchronization between cluster nodes, because technically it’s not part of the cluster, but you will have an option to check it with real data. Such slave can be easily added from ClusterControl.

ClusterControl add asynchronous slave

As shown in the above screenshot, ClusterControl can automate the process of adding an asynchronous slave in a few ways. You can add the node to the cluster, delay the slave. To reduce the impact on the master, you can use an existing backup instead of the master as the data source when building the slave.

Clone database and measure time

A good test should be as close as possible to the production change. The best way to do this is to clone your existing environment.

ClusterControl Clone Cluster for test

Perform changes via replication

To have better control over your changes, you can apply them on a slave server ahead of time and then do the switchover. For statement-based replication, this works fine, but for row-based replication, this can work up to a certain degree. Row-based replication enables extra columns to exist at the end of the table, so as long as it can write the first columns, it will be fine. First apply these setting to all slaves, then failover to one of the slaves and then implement the change to the master and attach that as a slave. If your modification involves inserting or removing a column in the middle of the table, it will work with row-based replication.

Operation

During the maintenance window, we do not want to have application traffic on the database. Sometimes it is hard to shut down all applications spread over the whole company. Alternatively, we want to allow only some specific hosts to access MySQL from remote (for example the monitoring system or the backup server). For this purpose, we can use the Linux packet filtering. To see what packet filtering rules are available, we can run the following command:

iptables -L INPUT -v

To close the MySQL port on all interfaces we use:

iptables -A INPUT -p tcp --dport mysql -j DROP

and to open the MySQL port again after the maintenance window:

iptables -D INPUT -p tcp --dport mysql -j DROP

For those without root access, you can change max_connection to 1 or 'skip networking'.

Logging

To get the logging process started, use the tee command at the MySQL client prompt, like this:

mysql> tee /tmp/my.out;

That command tells MySQL to log both the input and output of your current MySQL login session to a file named /tmp/my.out .Then execute your script file with source command.

To get a better idea of your execution times, you can combine it with the profiler feature. Start the profiler with

SET profiling = 1;

Then execute your Query with

SHOW PROFILES;

you see a list of queries the profiler has statistics for. So finally, you choose which query to examine with

SHOW PROFILE FOR QUERY 1;

Schema migration tools

Many times, a straight ALTER on the master is not possible - most of the cases it causes lag on the slave, and this may not be acceptable to the applications. What can be done, though, is to execute the change in a rolling mode. You can start with slaves and, once the change is applied to the slave, migrate one of the slaves as a new master, demote the old master to a slave and execute the change on it.

A tool that may help with such a task is Percona’s pt-online-schema-change. Pt-online-schema-change is straightforward - it creates a temporary table with the desired new schema (for instance, if we added an index, or removed a column from a table). Then, it creates triggers on the old table. Those triggers are there to mirror changes that happen on the original table to the new table. Changes are mirrored during the schema change process. If a row is added to the original table, it is also added to the new one. It emulates the way that MySQL alters tables internally, but it works on a copy of the table you wish to alter. It means that the original table is not locked, and clients may continue to read and change data in it.

Likewise, if a row is modified or deleted on the old table, it is also applied in the new table. Then, a background process of copying data (using LOW_PRIORITY INSERT) between old and new table begins. Once data has been copied, RENAME TABLE is executed.

Another intresting tool is gh-ost. Gh-ost creates a temporary table with the altered schema, just like pt-online-schema-change does. It executes INSERT queries, which use the following pattern to copy data from old to new table. Nevertheless it does not use triggers. Unfortunately triggers may be the source of many limitations. gh-ost uses the binary log stream to capture table changes and asynchronously applies them onto the ghost table. Once we verified that gh-ost can execute our schema change correctly, it’s time to actually execute it. Keep in mind that you may need to manually drop old tables that were created by gh-ost during the process of testing the migration. You can also use --initially-drop-ghost-table and --initially-drop-old-table flags to ask gh-ost to do it for you. The final command to execute is exactly the same as we used to test our change, we just added --execute to it.

pt-online-schema-change and gh-ost are very popular among Galera users. Nevertheless Galera has some additional options.The two methods Total Order Isolation (TOI) and Rolling Schema Upgrade (RSU) have both their pros and cons.

TOI - This is the default DDL replication method. The node that originates the writeset detects DDL at parsing time and sends out a replication event for the SQL statement before even starting the DDL processing. Schema upgrades run on all cluster nodes in the same total order sequence, preventing other transactions from committing for the duration of the operation. This method is good when you want your online schema upgrades to replicate through the cluster and don’t mind locking the entire table (similar to how default schema changes happened in MySQL).

SET GLOBAL wsrep_OSU_method='TOI';

RSU - perfom the schema upgrades locally. In this method, your writes are affecting only the node on which they are run. The changes do not replicate to the rest of the cluster.This method is good for non-conflicting operations and it will not slow down the cluster.

SET GLOBAL wsrep_OSU_method='RSU';

While the node processes the schema upgrade, it desynchronizes with the cluster. When it finishes processing the schema upgrade, it applies delayed replication events and synchronizes itself with the cluster. This could be a good option to run heavy index creations.

Conclusion

We presented here several different methods that may help you with planning your schema changes. Of course it all depends on your application and business requirements. You can design your change plan, perform necessary tests, but there is still a small chance that something will go wrong. According to Murphy’s law - “things will go wrong in any given situation, if you give them a chance”. So make sure you try out different ways of performing these changes, and pick the one that you are the most comfortable with.

Webinar Replay - Monitoring on Steroids for MySQL, MariaDB, PostgreSQL and MongoDB

$
0
0

Thanks for joining us this week for our webinar on monitoring MySQL, MariaDB, PostgreSQL and MongoDB with freely available community tools and more specifically one: ClusterControl Community Edition. The replay and slides are now available to watch on our website.

Monitoring is essential for operations teams to ensure that databases are up and running. However, as databases are increasingly being deployed in distributed topologies based on replication or clustering, what does it mean to our monitoring infrastructure? Is it ok to monitor individual components of a database cluster, or do we need a more holistic systems approach? Can we rely on SELECT 1 as health check when determining whether a database is up or down? Do we need high-resolution time-series charts of status counters? Are there ways to predict problems before they actually become one?

In this webinar replay, we discuss how to effectively monitor distributed database clusters or replication setups. We look at different types of monitoring infrastructures, from on-prem to cloud and from agent-based to agentless. Then we dive into the different monitoring features available in the free ClusterControl Community Edition - from time-series charts of metrics, dashboards, and queries to performance advisors.

If you would like to centralize the monitoring of your open source databases and achieve this at zero cost, please watch this webinar.

Agenda

  • Requirements for monitoring distributed database systems
  • Cloud-based vs On-prem monitoring solutions
  • Agent-based vs Agentless monitoring
  • Deep-dive into ClusterControl Community Edition
    • Architecture
    • Metrics Collection
    • Trending
    • Dashboards
    • Queries
    • Performance Advisors
    • Other features available to Community users

Speaker

Bartlomiej Oles is a MySQL and Oracle DBA, with over 15 years experience in managing highly available production systems at IBM, Nordea Bank, Acxiom, Lufthansa, and other Fortune 500 companies. In the past five years, his focus has been on building and applying automation tools to manage multi-datacenter database environments.

We look forward to “seeing” you there!

Hybrid OLTP/Analytics Database Workloads in Galera Cluster Using Asynchronous Slaves

$
0
0

Using Galera cluster is a great way of building a highly available environment for MySQL or MariaDB. It is a shared-nothing cluster environment which can be scaled even beyond 12-15 nodes. Galera has some limitations, though. It shines in low-latency environments and even though it can be used across WAN, the performance is limited by network latency. Galera performance can also be impacted if one of the nodes starts to behave incorrectly. For example, excessive load on one of the nodes may slow it down, resulting in slower handling of the writes and that will impact all of the other nodes in the cluster. On the other hand, it is quite impossible to run a business without analyzing your data. Such analysis, typically, requires running heavy queries, which is quite different from an OLTP workload. In this blog post, we will discuss an easy way of running analytical queries for data stored in Galera Cluster for MySQL or MariaDB, in a way that it does not impact the performance of the core cluster.

How to run analytical queries on Galera Cluster?

As we stated, running long running queries directly on a Galera cluster is doable, but perhaps not so good idea. Hardware-dependant, this can be acceptable solution (if you use strong hardware and you will not run a multi-threaded analytical workload) but even if CPU utilization will not be a problem, the fact that one of the nodes will have mixed workload (OLTP and OLAP) will alone pose some performance challenges. OLAP queries will evict data required for your OLTP workload from the buffer pool, and this will slow down your OLTP queries. Luckily, there is a simple yet efficient way of separating analytical workload from regular queries - an asynchronous replication slave.

Replication slave is a very simple solution - all you need is just another host which can be provisioned and asynchronous replication has to be configured from Galera Cluster to that node. With asynchronous replication, the slave will not impact the rest of the cluster in any way. No matter if it is heavily loaded, uses different (less powerful) hardware, it will just continue replicating from the core cluster. The worst case scenario is that the replication slave will start lagging behind but then it is up to you to implement multi-threaded replication or, eventually to scale up the replication slave.

Once the replication slave is up and running, you should run the heavier queries on it and offload the Galera cluster. This can be done in multiple ways, depending on your setup and environment. If you use ProxySQL, you can easily direct queries to the analytical slave based on the source host, user, schema or even the query itself. Otherwise it will be up to your application to send analytical queries to the correct host.

Setting up a replication slave is not very complex but it still can be tricky if you are not proficient with MySQL and tools like xtrabackup. The whole process would consist of setting up the repository on a new server and installing the MySQL database. Then you will have to provision that host using data from Galera cluster. You can use xtrabackup for that but other tools like mydumper/myloader or even mysqldump will work as well (as long as you execute them correctly). Once the data is there, you will have to setup the replication between a master Galera node and the replication slave. Finally, you would have to reconfigure your proxy layer to include the new slave and route the traffic towards it or make tweaks in how your application connects to the database in order to redirect some of the load to the replication slave.

What is important to keep in mind, this setup is not resilient. If the “master” Galera node would go down, the replication link will be broken and it will take a manual action to slave the replica off another master node in the Galera cluster.

This is not a big deal, especially if you use replication with GTID (Global Transaction ID) but you have to identify that the replication is broken and then take the manual action.

How to set up the asynchronous slave to Galera Cluster using ClusterControl?

Luckily, if you use ClusterControl, the whole process can be automated and it requires just a handful of clicks. The initial state has already been set up using ClusterControl - a 3 node Galera cluster with 2 ProxySQL nodes and 2 Keepalived nodes for high availability of both database and proxy layer.

Adding the replication slave is just a click away:

Replication, obviously, requires binary logs to be enabled. If you do not have binlogs enabled on your Galera nodes, you can do it also from the ClusterControl. Please keep in mind that enabling binary logs will require a node restart to apply the configuration changes.

Even if one node in the cluster has binary logs enabled (marked as “Master” on the screenshot above), it’s still good to enable binary log on at least one more node. ClusterControl can automatically failover the replication slave after it detects that the master Galera node crashed, but for that, another master node with binary logs enabled is required or it won’t have anything to fail over to.

As we stated, enabling binary logs requires restart. You can either perform it straight away, or just make the configuration changes and perform the restart at some other time.

After binlogs have been enabled on some of the Galera nodes, you can proceed with adding the replication slave. In the dialog you have to pick the master host, pass the hostname or IP address of the slave. If you have recent backups at hand (which you should do), you can use one to provision the slave. Otherwise ClusterControl will provision it using xtrabackup - all the recent master data will be streamed to the slave and then the replication will be configured.

After the job completed, a replication slave has been added to the cluster. As stated earlier, should the 10.0.0.101 die, another host in the Galera cluster will be picked as the master and ClusterControl will automatically slave 10.0.0.104 off another node.

As we use ProxySQL, we need to configure it. We’ll add a new server into ProxySQL.

We created another hostgroup (30) where we put our asynchronous slave. We also increased “Max Replication Lag” to 50 seconds from default 10. It is up to your business requirements how badly analytics slave can be lagging before it becomes a problem.

After that we have to configure a query rule that will match our OLAP traffic and route it to the OLAP hostgroup (30). On the screenshot above we filled several fields - this is not mandatory. Typically you will need to use one, two of them at most. Above screenshot serves as an example so we can easily see that you can match queries using schema (if you have a separate schema with analytical data), hostname/IP (if OLAP queries are executed from some particular host), user (if application uses particular user for analytical queries. You can also match queries directly by either passing a full query or by marking them with SQL comments and let ProxySQL route all queries with a “OLAP_QUERY” string to our analytical hostgroup.

As you can see, thanks to ClusterControl we were able to deploy a replication slave to Galera Cluster in just a couple of clicks. Some may argue that MySQL is not the most suitable database for analytical workload and we tend to agree. You can easily extend this setup using ClickHouse and by setting up a replication from asynchronous slave to ClickHouse columnar datastore for much better performance of analytical queries. We described this setup in one of the earlier blog posts.


High Availability on a Shoestring Budget - Deploying a Minimal Two Node MySQL Galera Cluster

$
0
0

We regularly get questions about how to set up a Galera cluster with just 2 nodes.

The documentation clearly states you should have at least 3 Galera nodes to avoid network partitioning. But there are some valid reasons for considering a 2 node deployment, e.g., if you want to achieve database high availability but have a limited budget to spend on a third database node. Or perhaps you are running Galera in a development/sandbox environment and prefer a minimal setup.

Galera implements a quorum-based algorithm to select a primary component through which it enforces consistency. The primary component needs to have a majority of votes, so in a 2 node system, there would be no majority resulting in split brain. Fortunately, it is possible to add a garbd (Galera Arbitrator Daemon), which is a lightweight stateless daemon that can act as the odd node. Arbitrator failure does not affect the cluster operations and a new instance can be reattached to the cluster at any time. There can be several arbitrators in the cluster.

ClusterControl has support for deploying garbd on non-database hosts.

Normally a Galera cluster needs at least three hosts to be fully functional, however, at deploy time, two nodes would suffice to create a primary component. Here are the steps:

  1. Deploy a Galera cluster of two nodes,
  2. After the cluster has been deployed by ClusterControl, add garbd on the ClusterControl node.

You should end up with the below setup:

Deploy the Galera Cluster

Go to the ClusterControl Deploy section to deploy the cluster.

After selecting the technology that we want to deploy, we must specify User, Key or Password and port to connect by SSH to our hosts. We also need the name for our new cluster and if we want ClusterControl to install the corresponding software and configurations for us.

After setting up the SSH access information, we must select vendor/version and we must define the database admin password, datadir and port. We can also specify which repository to use.

Even though ClusterControl warns you that a Galera cluster needs an odd number of nodes, only add two nodes to the cluster.

Deploying a Galera cluster will trigger a ClusterControl job which can be monitored at the Jobs page.

ClusterControl
Single Console for Your Entire Database Infrastructure
Find out what else is new in ClusterControl

Install Garbd

Once deployment is complete, install garbd on the ClusterControl host. We have the option to deploy garbd from ClusterControl, but this option won’t work if we want to deploy it in the same ClusterControl server. This is to avoid some issue related to the database versions and package dependencies.

So, we must install it manually, and then import garbd to ClusterControl.

Let’s see the manual installation of Percona Garbd on CentOS 7.

Create the Percona repository file:

$ vi /etc/yum.repos.d/percona.repo
[percona-release-$basearch]
name = Percona-Release YUM repository - $basearch
baseurl = http://repo.percona.com/release/$releasever/RPMS/$basearch
enabled = 1
gpgcheck = 0
[percona-release-noarch]
name = Percona-Release YUM repository - noarch
baseurl = http://repo.percona.com/release/$releasever/RPMS/noarch
enabled = 1
gpgcheck = 0
[percona-release-source]
name = Percona-Release YUM repository - Source packages
baseurl = http://repo.percona.com/release/$releasever/SRPMS
enabled = 0
gpgcheck = 0

Then, install the Percona XtraDB Cluster garbd package:

$ yum install Percona-XtraDB-Cluster-garbd-57

Now, we need to configure garbd. For this, we need to edit the /etc/sysconfig/garb file:

$ vi /etc/sysconfig/garb
# Copyright (C) 2012 Codership Oy
# This config file is to be sourced by garb service script.
# A comma-separated list of node addresses (address[:port]) in the cluster
GALERA_NODES="192.168.100.192:4567,192.168.100.193:4567"
# Galera cluster name, should be the same as on the rest of the nodes.
GALERA_GROUP="Galera1"
# Optional Galera internal options string (e.g. SSL settings)
# see http://galeracluster.com/documentation-webpages/galeraparameters.html
# GALERA_OPTIONS=""
# Log file for garbd. Optional, by default logs to syslog
# Deprecated for CentOS7, use journalctl to query the log for garbd
# LOG_FILE=""

Change the GALERA_NODES and GALERA_GROUP parameter according to the Galera nodes configuration. We also need to remove the line # REMOVE THIS AFTER CONFIGURATION before starting the service.

And now, we can start the garb service:

$ service garb start
Redirecting to /bin/systemctl start garb.service

Now, we can import the new garbd into ClusterControl.

Go to ClusterControl -> Select Cluster -> Add Load Balancer.

Then, select Garbd and Import Garbd section.

Here we only need to specify the hostname or IP Address and the port of the new Garbd.

Importing garbd will trigger a ClusterControl job which can be monitored at the Jobs page. Once completed, you can verify garbd is running with a green tick icon at the top bar:

That’s it!

Our minimal two-node Galera cluster is now ready!

Understanding the Effects of High Latency in High Availability MySQL and MariaDB Solutions

$
0
0

High availability is a high percentage of time that the system is working and responding according to the business needs. For production database systems it is typically the highest priority to keep it close to 100%. We build database clusters to eliminate all single point of failure. If an instance becomes unavailable, another node should be able to take the workload and carry on from there. In a perfect world, a database cluster would solve all of our system availability problems. Unfortunately, while all may look good on paper, the reality is often different. So where can it go wrong?

Transactional databases systems come with sophisticated storage engines. Keeping data consistent across multiple nodes makes this task way harder. Clustering introduces a number of new variables that highly depend on network and underlying infrastructure. It is not uncommon for a standalone database instance that was running fine on a single node suddenly performs poorly in a cluster environment.

Among the number of things that can affect cluster availability, latency issues play a crucial role. However, what is the latency? Is it only related to the network?

The term "latency" actually refers to several kinds of delays incurred in the processing of data. It’s how long it takes for a piece of information to move from stage to another.

In this blog post, we’ll look at the two main high availability solutions for MySQL and MariaDB, and how they can each be affected by latency issues.

At the end of the article, we take a look at modern load balancers and discuss how they can help you address some types of latency issues.

In a previous article, my colleague Krzysztof Książek wrote about "Dealing with Unreliable Networks When Crafting an HA Solution for MySQL or MariaDB". You will find tips which can help you to design your production ready HA architecture, and avoid some of the issues described here.

Master-Slave replication for High Availability.

MySQL master-slave replication is probably the most popular database cluster type on the planet. One of the main things you want to monitor while running your master-slave replication cluster is the slave lag. Depending on your application requirements and the way how you utilize your database, the replication latency (slave lag) may determine if the data can be read from the slave node or not. Data committed on master but not yet available on an asynchronous slave means that the slave has an older state. When it’s not ok to read from a slave, you would need to go to the master, and that can affect application performance. In the worst case scenario, your system will not be able to handle all the workload on a master.

Slave lag and stale data

To check the status of the master-slave replication, you should start with below command:

SHOW SLAVE STATUS\G
MariaDB [(none)]> show slave status\G
*************************** 1. row ***************************
               Slave_IO_State: Waiting for master to send event
                  Master_Host: 10.0.3.100
                  Master_User: rpl_user
                  Master_Port: 3306
                Connect_Retry: 10
              Master_Log_File: binlog.000021
          Read_Master_Log_Pos: 5101
               Relay_Log_File: relay-bin.000002
                Relay_Log_Pos: 809
        Relay_Master_Log_File: binlog.000021
             Slave_IO_Running: Yes
            Slave_SQL_Running: Yes
              Replicate_Do_DB: 
          Replicate_Ignore_DB: 
           Replicate_Do_Table: 
       Replicate_Ignore_Table: 
      Replicate_Wild_Do_Table: 
  Replicate_Wild_Ignore_Table: 
                   Last_Errno: 0
                   Last_Error: 
                 Skip_Counter: 0
          Exec_Master_Log_Pos: 5101
              Relay_Log_Space: 1101
              Until_Condition: None
               Until_Log_File: 
                Until_Log_Pos: 0
           Master_SSL_Allowed: No
           Master_SSL_CA_File: 
           Master_SSL_CA_Path: 
              Master_SSL_Cert: 
            Master_SSL_Cipher: 
               Master_SSL_Key: 
        Seconds_Behind_Master: 0
Master_SSL_Verify_Server_Cert: No
                Last_IO_Errno: 0
                Last_IO_Error: 
               Last_SQL_Errno: 0
               Last_SQL_Error: 
  Replicate_Ignore_Server_Ids: 
             Master_Server_Id: 3
               Master_SSL_Crl: 
           Master_SSL_Crlpath: 
                   Using_Gtid: Slave_Pos
                  Gtid_IO_Pos: 0-3-1179
      Replicate_Do_Domain_Ids: 
  Replicate_Ignore_Domain_Ids: 
                Parallel_Mode: conservative
1 row in set (0.01 sec)

Using the above information you can determine how good the overall replication latency is. The lower the value you see in "Seconds_Behind_Master", the better the data transfer speed for replication.

Another way to monitor slave lag is to use ClusterControl replication monitoring. In this screenshot we can see the replication status of asymchoronous Master-Slave (2x) Cluster with ProxySQL.

There are a number of things that can affect replication time. The most obvious is the network throughput and how much data you can transfer. MySQL comes with multiple configuration options to optimize replication process. The essential replication related parameters are:

  • Parallel apply
  • Logical clock algorithm
  • Compression
  • Selective master-slave replication
  • Replication mode

Parallel apply

It’s not uncommon to start replication tuning with enabling parallel process apply. The reason for that is by default, MySQL goes with sequential binary log apply, and a typical database server comes with several CPUs to use.

To get around sequential log apply, both MariaDB and MySQL offer parallel replication. The implementation may differ per vendor and version. E.g. MySQL 5.6 offers parallel replication as long as a schema separates the queries while MariaDB (starting version 10.0) and MySQL 5.7 both can handle parallel replication across schemas. Different vendors and versions come with their limitations and feature so always check the documentation.

Executing queries via parallel slave threads may speed up your replication stream if you are write heavy. However, if you aren’t, it would be best to stick to the traditional single-threaded replication. To enable parallel processing, change the slave_parallel_workers to the number of CPU threads you want to involve in the process. It is recommended to keep the value lower of the number of available CPU threads.

Parallel replication works best with the group commits. To check if you have group commits happening run following query.

show global status like 'binlog_%commits';

The bigger the ratio between these two values the better.

Logical clock

The slave_parallel_type=LOGICAL_CLOCK is an implementation of a Lamport clock algorithm. When using a multithreaded slave this variable specifies the method used to decide which transactions are allowed to execute in parallel on the slave. The variable has no effect on slaves for which multithreading is not enabled so make sure slave_parallel_workers is set higher than 0.

MariaDB users should also check optimistic mode introduced in version 10.1.3 as it also may give you better results.

GTID

MariaDB comes with its own implementation of GTID. MariaDB’s sequence consists of a domain, server, and transaction. Domains allow multi-source replication with distinct ID. Different domain ID’s can be used to replicate the portion of data out-of-order (in parallel). As long it’s okayish for your application this can reduce replication latency.

The similar technique applies to MySQL 5.7 which can also use the multisource master and independent replication channels.

Compression

CPU power is getting less expensive over time, so using it for binlog compression could be a good option for many database environments. The slave_compressed_protocol parameter tells MySQL to use compression if both master and slave support it. By default, this parameter is disabled.

Starting from MariaDB 10.2.3, selected events in the binary log can be optionally compressed, to save the network transfers.

Replication formats

MySQL offers several replication modes. Choosing the right replication format helps to minimize the time to pass data between the cluster nodes.

Multimaster Replication For High Availability

Some applications can not afford to operate on outdated data.

In such cases, you may want to enforce consistency across the nodes with synchronous replication. Keeping data synchronous requires an additional plugin, and for some, the best solution on the market for that is Galera Cluster.

Galera cluster comes with wsrep API which is responsible of transmitting transactions to all nodes and executing them according to a cluster-wide ordering. This will block the execution of subsequent queries until the node has applied all write-sets from its applier queue. While it’s a good solution for consistency, you may hit some architectural limitations. The common latency issues can be related to:

  • The slowest node in the cluster
  • Horizontal scaling and write operations
  • Geolocated clusters
  • High Ping
  • Transaction size

The slowest node in the cluster

By design, the write performance of the cluster cannot be higher than the performance of the slowest node in the cluster. Start your cluster review by checking the machine resources and verify the configuration files to make sure they all run on the same performance settings.

Parallelization

Parallel threads do not guarantee better performance, but it may speed up the synchronization of new nodes with the cluster. The status wsrep_cert_deps_distance tells us the possible degree of parallelization. It is the value of the average distance between the highest and lowest seqno values that can be possibly applied in parallel. You can use the wsrep_cert_deps_distance status variable to determine the maximum number of slave threads possible.

Horizontal scaling

By adding more nodes in the cluster, we have fewer points that could fail; however, the information needs to go across multi-instances until it’s committed, which multiplies the response times. If you need scalable writes, consider an architecture based on sharding. A good solution can be a Spider storage engine.

In some cases, to reduce information shared across the cluster nodes, you can consider having one writer at a time. It’s relatively easy to implement while using a load balancer. When you do this manually make sure you have a procedure to change DNS value when your writer node goes down.

Geolocated clusters

Although Galera Cluster is synchronous, it is possible to deploy a Galera Cluster across data centers. Synchronous replication like MySQL Cluster (NDB) implements a two-phase commit, where messages are sent to all nodes in a cluster in a 'prepare' phase, and another set of messages are sent in a 'commit' phase. This approach is usually not suitable for geographically disparate nodes, because of the latencies in sending messages between nodes.

High Ping

Galera Cluster with the default settings does not handle well high network latency. If you have a network with a node that shows a high ping time, consider changing evs.send_window and evs.user_send_window parameters. These variables define the maximum number of data packets in replication at a time. For WAN setups, the variable can be set to a considerably higher value than the default value of 2. It’s common to set it to 512. These parameters are part of wsrep_provider_options.

--wsrep_provider_options="evs.send_window=512;evs.user_send_window=512"

Transaction size

One of the things you need to consider while running Galera Cluster is the size of the transaction. Finding the balance between the transaction size, performance and Galera certification process is something you have to estimate in your application. You can find more information about that in the article How to Improve Performance of Galera Cluster for MySQL or MariaDB by Ashraf Sharif.

Load Balancer Causal Consistency Reads

Even with the minimized risk of data latency issues, standard MySQL asynchronous replication cannot guarantee consistency. It is still possible that the data is yet not replicated to slave while your application is reading it from there. Synchronous replication can solve this problem, but it has architecture limitations and may not fit your application requirements (e.g., intensive bulk writes). So how to overcome it?

The first step to avoid stale data reading is to make the application aware of replication delay. It is usually programmed in application code. Fortunately, there are modern database load balancers with the support of adaptive query routing based on GTID tracking. The most popular are ProxySQL and Maxscale.

ProxySQL 2.0

ProxySQL Binlog Reader allows ProxySQL to know in real time which GTID has been executed on every MySQL server, slaves and master itself. Thanks to this, when a client executes a reads that needs to provide causal consistency reads, ProxySQL immediately knows on which server the query can be executed. If for whatever reason the writes were not executed on any slave yet, ProxySQL will know that the writer was executed on master and send the read there.

Maxscale 2.3

MariaDB introduced casual reads in Maxscale 2.3.0. The way it works it’s similar to ProxySQL 2.0. Basically when causal_reads are enabled, any subsequent reads performed on slave servers will be done in a manner that prevents replication lag from affecting the results. If the slave has not caught up to the master within the configured time, the query will be retried on the master.

How to Deploy Open Source Databases - New Whitepaper

$
0
0

We’re happy to announce that our new whitepaper How to Deploy Open Source Databases is now available to download for free!

Choosing which DB engine to use between all the options we have today is not an easy task. An that is just the beginning. After deciding which engine to use, you need to learn about it and actually deploy it to play with it. We plan to help you on that second step, and show you how to install, configure and secure some of the most popular open source DB engines.

In this whitepaper we are going to explore the top open source databases and how to deploy each technology using proven methodologies that are battle-tested.

Topics included in this whitepaper are …

  • An Overview of Popular Open Source Databases
    • Percona
    • MariaDB
    • Oracle MySQL
    • MongoDB
    • PostgreSQL
  • How to Deploy Open Source Databases
    • Percona Server for MySQL
    • Oracle MySQL Community Server
      • Group Replication
    • MariaDB
      • MariaDB Cluster Configuration
    • Percona XtraDB Cluster
    • NDB Cluster
    • MongoDB
    • Percona Server for MongoDB
    • PostgreSQL
  • How to Deploy Open Source Databases by Using ClusterControl
    • Deploy
    • Scaling
    • Load Balancing
    • Management   

Download the whitepaper today!

ClusterControl
Single Console for Your Entire Database Infrastructure
Find out what else is new in ClusterControl

About ClusterControl

ClusterControl is the all-inclusive open source database management system for users with mixed environments that removes the need for multiple management tools. ClusterControl provides advanced deployment, management, monitoring, and scaling functionality to get your MySQL, MongoDB, and PostgreSQL databases up-and-running using proven methodologies that you can depend on to work. At the core of ClusterControl is it’s automation functionality that lets you automate many of the database tasks you have to perform regularly like deploying new databases, adding and scaling new nodes, running backups and upgrades, and more.

To learn more about ClusterControl click here.

About Severalnines

Severalnines provides automation and management software for database clusters. We help companies deploy their databases in any environment, and manage all operational aspects to achieve high-scale availability.

Severalnines' products are used by developers and administrators of all skill levels to provide the full 'deploy, manage, monitor, scale' database cycle, thus freeing them from the complexity and learning curves that are typically associated with highly available database clusters. Severalnines is often called the “anti-startup” as it is entirely self-funded by its founders. The company has enabled over 32,000 deployments to date via its popular product ClusterControl. Currently counting BT, Orange, Cisco, CNRS, Technicolor, AVG, Ping Identity and Paytrail as customers. Severalnines is a private company headquartered in Stockholm, Sweden with offices in Singapore, Japan and the United States. To see who is using Severalnines today visit, https://www.severalnines.com/company.

Benchmarking Manual Database Deployments vs Automated Deployments

$
0
0

There are multiple ways of deploying a database. You can install it by hand, you can rely on the widely available infrastructure orchestration tools like Ansible, Chef, Puppet or Salt. Those tools are very popular and it is quite easy to find scripts, recipes, playbooks, you name it, which will help you automate the installation of a database cluster. There are also more specialized database automation platforms, like ClusterControl, which can also be used to automated deployment. What would be the best way of deploying your cluster? How much time you will actually need to deploy it?

First, let us clarify what we want to do. Let’s assume we will be deploying Percona XtraDB Cluster 5.7. It will consist of three nodes and for that we will use three Vagrant virtual machines running Ubuntu 16.04 (bento/ubuntu-16.04 image). We will attempt to deploy a cluster manually, then using Ansible and ClusterControl. Let’s see how the results will look like.

Manual Deployment

Repository Setup - 1 minute, 45 seconds.

First of all, we have to configure Percona repositories on all Ubuntu nodes. Quick google search, ssh into the virtual machines and running required commands takes 1m45s

We found the following page with instructions:
https://www.percona.com/doc/percona-repo-config/percona-release.html

and we executed steps described in “DEB-BASED GNU/LINUX DISTRIBUTIONS” section. We also ran apt update, to refresh apt’s cache.

Installing PXC Nodes - 2 minutes 45 seconds

This step basically consists of executing:

root@vagrant:~# apt install percona-xtradb-cluster-5.7

The rest is mostly dependent on your internet connection speed as packages are being downloaded. Your input will also be needed (you’ll be passing a password for the superuser) so it is not unattended installation. When everything is done, you will end up with three running Percona XtraDB Cluster nodes:

root     15488  0.0  0.2   4504  1788 ?        S    10:12   0:00 /bin/sh /usr/bin/mysqld_safe
mysql    15847  0.3 28.3 1339576 215084 ?      Sl   10:12   0:00  \_ /usr/sbin/mysqld --basedir=/usr --datadir=/var/lib/mysql --plugin-dir=/usr/lib/mysql/plugin --user=mysql --wsrep-provider=/usr/lib/galera3/libgalera_smm.so --log-error=/var/log/mysqld.log --pid-file=/var/run/mysqld/mysqld.pid --socket=/var/run/mysqld/mysqld.sock --wsrep_start_position=00000000-0000-0000-0000-000000000000:-1

Configuring PXC nodes - 3 minutes, 25 seconds

Here starts the tricky part. It is really hard to quantify experience and how much time one would need to actually understand what is needed to be done. What is good, google search “how to install percona xtrabdb cluster” points to Percona’s documentation, which describes how the process should look like. It still may take more or less time, depending on how familiar you are with the PXC and Galera in general. Worst case scenario you will not be aware of any additional required actions and you will connect to your PXC and start working with it, not realizing that, in fact, you have three nodes, each forming a cluster of its own.

Let’s assume we follow the recommendation from Percona and time just those steps to be executed. In short, we modified configuration files as per instructions on the Percona website, we also attempted to bootstrap the first node:

root@vagrant:~# /etc/init.d/mysql bootstrap-pxc
mysqld: [ERROR] Found option without preceding group in config file /etc/mysql/my.cnf at line 10!
mysqld: [ERROR] Fatal error in defaults handling. Program aborted!
mysqld: [ERROR] Found option without preceding group in config file /etc/mysql/my.cnf at line 10!
mysqld: [ERROR] Fatal error in defaults handling. Program aborted!
mysqld: [ERROR] Found option without preceding group in config file /etc/mysql/my.cnf at line 10!
mysqld: [ERROR] Fatal error in defaults handling. Program aborted!
mysqld: [ERROR] Found option without preceding group in config file /etc/mysql/my.cnf at line 10!
mysqld: [ERROR] Fatal error in defaults handling. Program aborted!
 * Bootstrapping Percona XtraDB Cluster database server mysqld                                                                                                                                                                                                                     ^C

This did not look correct. Unfortunately, instructions weren’t crystal clear. Again, if you don’t know what is going on, you will spend more time trying to understand what happened. Luckily, stackoverflow.com comes very helpful (although not the first response on the list that we got) and you should realise that you miss [mysqld] section header in your /etc/mysql/my.cnf file. Adding this on all nodes and repeating the bootstrap process solved the issue. In total we spent 3 minutes and 25 seconds (not including googling for the error as we noticed immediately what was the problem).

Configuring for SST, Bringing Other Nodes Into the Cluster - Starting From 8 Minutes to Infinity

The instructions on Percona web site are quite clear. Once you have one node up and running, just start remaining nodes and you will be fine. We tried that and we were unable to see more nodes joining the cluster. This is where it is virtually impossible to tell how long it will take to diagnose the issue. It took us 6-7 minutes but to be able to do it quickly you have to:

  1. Be familiar with how PXC configuration is structured:
    root@vagrant:~# tree  /etc/mysql/
    /etc/mysql/
    ├── conf.d
    │   ├── mysql.cnf
    │   └── mysqldump.cnf
    ├── my.cnf -> /etc/alternatives/my.cnf
    ├── my.cnf.fallback
    ├── my.cnf.old
    ├── percona-xtradb-cluster.cnf
    └── percona-xtradb-cluster.conf.d
        ├── client.cnf
        ├── mysqld.cnf
        ├── mysqld_safe.cnf
        └── wsrep.cnf
  2. Know how the !include and !includedir directives work in MySQL configuration files
  3. Know how MySQL handles the same variables included in multiple files
  4. Know what to look for and be aware of configurations that would result in node bootstrapping itself to form a cluster on its own

The problem was related to the fact that instructions did not mention any file except for /etc/mysql/my.cnf where, in fact, we should have been modifying /etc/mysql/percona-xtradb-cluster.conf.d/wsrep.cnf. That file contained empty variable:

wsrep_cluster_address=gcomm://

and such configuration forces node to bootstrap as it does not have information about other nodes to join to. We set that variable in /etc/mysql/my.cnf but later wsrep.cnf file was included, overwriting our setup.

This issue might be a serious blocker for people who are not really familiar with how MySQL and Galera works, resulting even in hours if not more of debugging.

Total Installation Time - 16 minutes (If You Are MySQL DBA Like I Am)

We managed to install Percona XtraDB Cluster in 16 minutes. You have to keep in mind a couple of things - we did not tune the configuration. This is something which will require more time and knowledge. PXC node comes with some simple configuration, related mostly to binary logging and Galera writeset replication. There is no InnoDB tuning. If you are not familiar with MySQL internals, this is hours if not days of reading and familiarizing yourself with internal mechanisms. Another important thing is that this is a process you would have to re-apply for every cluster you deploy. Finally, we managed to identify the issue and solve it very fast due to our experience with Percona XtraDB Cluster and MySQL in general. Casual user will most likely spend significantly more time trying to understand what is going on and why.

Ansible Playbook

Now, on to automation with Ansible. Let’s try to find and use an ansible playbook, which we could reuse for all further deployments. Let’s see how long will it take to do that.

Configuring SSH Connectivity - 1 minute

Ansible requires SSH connectivity across all the nodes to connect and configure them. We generated a SSH key and manually distributed it across the nodes.

Finding Ansible Playbook - 2 minutes 15 seconds

The main issue here is that there are so many playbooks available out there that it is impossible to decide what’s best. As such, we decided to go with top 3 Google results and try to pick one. We decided on https://github.com/cdelgehier/ansible-role-XtraDB-Cluster as it seems to be more configurable than the remaining ones.

Cloning Repository and Installing Ansible - 30 seconds

This is quick, all we needed was to

apt install ansible git
git clone https://github.com/cdelgehier/ansible-role-XtraDB-Cluster.git

Preparing Inventory File - 1 minute 10 seconds

This step was also very simple, we created an inventory file using example from documentation. We just substituted IP addresses of the nodes to what we have configured in our environment.

Preparing a Playbook - 1 minute 45 seconds

We decided to use the most extensive example from the documentation, which includes also a bit of the configuration tuning. We prepared a correct structure for the Ansible (there was no such information in the documentation):

/root/pxcansible/
├── inventory
├── pxcplay.yml
└── roles
    └── ansible-role-XtraDB-Cluster

Then we ran it but immediately we got an error:

root@vagrant:~/pxcansible# ansible-playbook pxcplay.yml
 [WARNING]: provided hosts list is empty, only localhost is available

ERROR! no action detected in task

The error appears to have been in '/root/pxcansible/roles/ansible-role-XtraDB-Cluster/tasks/main.yml': line 28, column 3, but may
be elsewhere in the file depending on the exact syntax problem.

The offending line appears to be:


- name: "Include {{ ansible_distribution }} tasks"
  ^ here
We could be wrong, but this one looks like it might be an issue with
missing quotes.  Always quote template expression brackets when they
start a value. For instance:

    with_items:
      - {{ foo }}

Should be written as:

    with_items:
      - "{{ foo }}"

This took 1 minute and 45 seconds.

Fixing the Playbook Syntax Issue - 3 minutes 25 seconds

The error was misleading but the general rule of thumb is to try more recent Ansible version, which we did. We googled and found good instructions on Ansible website. Next attempt to run the playbook also failed:

TASK [ansible-role-XtraDB-Cluster : Delete anonymous connections] *****************************************************************************************************************************************************************************************************************
fatal: [node2]: FAILED! => {"changed": false, "msg": "The PyMySQL (Python 2.7 and Python 3.X) or MySQL-python (Python 2.X) module is required."}
fatal: [node3]: FAILED! => {"changed": false, "msg": "The PyMySQL (Python 2.7 and Python 3.X) or MySQL-python (Python 2.X) module is required."}
fatal: [node1]: FAILED! => {"changed": false, "msg": "The PyMySQL (Python 2.7 and Python 3.X) or MySQL-python (Python 2.X) module is required."}

Setting up new Ansible version and running the playbook up to this error took 3 minutes and 25 seconds.

Fixing the Missing Python Module - 3 minutes 20 seconds

Apparently, the role we used did not take care of its prerequisites and a Python module was missing for connecting to and securing the Galera cluster. We first tried to install MySQL-python via pip but it became apparent that it will take more time as it required mysql_config:

root@vagrant:~# pip install MySQL-python
Collecting MySQL-python
  Downloading https://files.pythonhosted.org/packages/a5/e9/51b544da85a36a68debe7a7091f068d802fc515a3a202652828c73453cad/MySQL-python-1.2.5.zip (108kB)
    100% |████████████████████████████████| 112kB 278kB/s
    Complete output from command python setup.py egg_info:
    sh: 1: mysql_config: not found
    Traceback (most recent call last):
      File "<string>", line 1, in <module>
      File "/tmp/pip-build-zzwUtq/MySQL-python/setup.py", line 17, in <module>
        metadata, options = get_config()
      File "/tmp/pip-build-zzwUtq/MySQL-python/setup_posix.py", line 43, in get_config
        libs = mysql_config("libs_r")
      File "/tmp/pip-build-zzwUtq/MySQL-python/setup_posix.py", line 25, in mysql_config
        raise EnvironmentError("%s not found" % (mysql_config.path,))
    EnvironmentError: mysql_config not found

    ----------------------------------------
Command "python setup.py egg_info" failed with error code 1 in /tmp/pip-build-zzwUtq/MySQL-python/

That is provided by MySQL development libraries so we would have to install them manually, which was pretty much pointless. We decided to go with PyMySQL, which did not require other packages to install. This brought us to another issue:

TASK [ansible-role-XtraDB-Cluster : Delete anonymous connections] *****************************************************************************************************************************************************************************************************************
fatal: [node3]: FAILED! => {"changed": false, "msg": "unable to connect to database, check login_user and login_password are correct or /root/.my.cnf has the credentials. Exception message: (1698, u\"Access denied for user 'root'@'localhost'\")"}
fatal: [node2]: FAILED! => {"changed": false, "msg": "unable to connect to database, check login_user and login_password are correct or /root/.my.cnf has the credentials. Exception message: (1698, u\"Access denied for user 'root'@'localhost'\")"}
fatal: [node1]: FAILED! => {"changed": false, "msg": "unable to connect to database, check login_user and login_password are correct or /root/.my.cnf has the credentials. Exception message: (1698, u\"Access denied for user 'root'@'localhost'\")"}
    to retry, use: --limit @/root/pxcansible/pxcplay.retry

Up to this point we spent 3 minutes and 20 seconds.

Fixing “Access Denied” Error - 18 minutes 55 seconds

As per error, we did ensure that MySQL config is prepared correctly and that it included correct user and password to connect to the database. This, unfortunately, did not work as expected. We did investigate further and found that the role did not create root user properly, even though it marked the step as completed. We did a short investigation but decided to make the manual fix instead of trying to debug the playbook, which would take way more time than the steps which we did. We just created manually users root@127.0.0.1 and root@localhost with correct passwords. This allowed us to pass this step and onto another error:

TASK [ansible-role-XtraDB-Cluster : Start the master node] ************************************************************************************************************************************************************************************************************************
skipping: [node1]
skipping: [node2]
skipping: [node3]

TASK [ansible-role-XtraDB-Cluster : Create SST user] ******************************************************************************************************************************************************************************************************************************
skipping: [node1]
skipping: [node2]
skipping: [node3]

TASK [ansible-role-XtraDB-Cluster : Start the slave nodes] ************************************************************************************************************************************************************************************************************************
fatal: [node3]: FAILED! => {"changed": false, "msg": "Unable to start service mysql: Job for mysql.service failed because the control process exited with error code. See \"systemctl status mysql.service\" and \"journalctl -xe\" for details.\n"}
fatal: [node2]: FAILED! => {"changed": false, "msg": "Unable to start service mysql: Job for mysql.service failed because the control process exited with error code. See \"systemctl status mysql.service\" and \"journalctl -xe\" for details.\n"}
fatal: [node1]: FAILED! => {"changed": false, "msg": "Unable to start service mysql: Job for mysql.service failed because the control process exited with error code. See \"systemctl status mysql.service\" and \"journalctl -xe\" for details.\n"}
    to retry, use: --limit @/root/pxcansible/pxcplay.retry

For this section we spent 18 minutes and 55 seconds.

Fixing “Start the Slave Nodes” Issue (part 1) - 7 minutes 40 seconds

We tried a couple of things to solve this problem. We tried to specify node using its name, we tried to switch group names, nothing solved the issue. We decided to clean up the environment using the script provided in the documentation and start from scratch. It did not clean it but just made things even worse. After 7 minutes and 40 seconds we decided to wipe out the virtual machines, recreate the environment and start from scratch hoping that when we add the Python dependencies, this will solve our issue.

Fixing “Start the Slave Nodes” Issue (part 2) - 13 minutes 15 seconds

Unfortunately, setting up Python prerequisites did not help at all. We decided to finish the process manually, bootstrapping the first node and then configuring SST user and starting remaining slaves. This completed the “automated” setup and it took us 13 minutes and 15 seconds to debug and then finally accept that it will not work like the playbook designer expected.

Further Debugging - 10 minutes 45 seconds

We did not stop there and decided that we’ll try one more thing. Instead of relying on Ansible variables we just put the IP of one of the nodes as the master node. This solved that part of the problem and we ended up with:

TASK [ansible-role-XtraDB-Cluster : Create SST user] ******************************************************************************************************************************************************************************************************************************
skipping: [node2]
skipping: [node3]
fatal: [node1]: FAILED! => {"changed": false, "msg": "unable to connect to database, check login_user and login_password are correct or /root/.my.cnf has the credentials. Exception message: (1045, u\"Access denied for user 'root'@'::1' (using password: YES)\")"}

This was the end of our attempts - we tried to add this user but it did not work correctly through the ansible playbook while we could use IPv6 localhost address to connect to when using MySQL client.

Total Installation Time - Unknown (Automated Installation Failed)

In total we spent 64 minutes and we still haven’t managed to get things going automatically. The remaining problems are root password creation which doesn’t seem to work and then getting the Galera Cluster started (SST user issue). It is hard to tell how long will it take to debug it further. It is sure possible - it is just hard to quantify because it really depends on the experience with Ansible and MySQL. It is definitely not something anyone can just download, configure and run. Well, maybe another playbook would have worked differently? It is possible, but it may as well result in different issues. Ok, so there is a learning curve to climb and debugging to make but then, when you are all set, you will just run a script. Well, that’s sort of true. As long as changes introduced by the maintainer won’t break something you depend on or new Ansible version will break the playbook or the maintainer will just forget about the project and stop developing it (for the role that we used there’s quite useful pull request waiting already for almost a year, which might be able to solve the Python dependency issue - it has not been merged). Unless you accept that you will have to maintain this code, you cannot really rely on it being 100% accurate and working in your environment, especially given that the original developer has no incentives in keeping the code up to date. Also, what about other versions? You cannot use this particular playbook to install PXC 5.6 or any MariaDB version. Sure, there are other playbooks you can find. Will they work better or maybe you’ll spend another bunch of hours trying to make them to work?

ClusterControl
Single Console for Your Entire Database Infrastructure
Find out what else is new in ClusterControl

ClusterControl

Finally, let’s take a look at how ClusterControl can be used to deploy Percona XtraDB Cluster.

Configuring SSH Connectivity - 1 minute

ClusterControl requires SSH connectivity across all the nodes to connect and configure them. We generated a SSH key and manually distributed it across the nodes.

Setting Up ClusterControl - 3 minutes 15 seconds

Quick search “ClusterControl install” pointed us to relevant ClusterControl documentation page. We were looking for a “simpler way to install ClusterControl” therefore we followed the link and found following instructions.

Downloading the script and running it took 3 minutes and 15 seconds, we had to take some actions while installation proceeded so it is not unattended installation.

Logging Into UI and Deployment Start - 1 minute 10 seconds

We pointed our browser to the IP of ClusterControl node.

We passed the required contact information and we were presented with the Welcome screen:

Next step - we picked the deployment option.

We had to pass SSH connectivity details.

We also decided on the vendor, version, password and hosts to use. This whole process took 1 minute and 10 seconds.

Percona XtraDB Cluster Deployment - 12 minutes 5 seconds

The only thing left was to wait for ClusterControl to finish the deployment. After 12 minutes and 5 seconds the cluster was ready:

Total Installation Time - 17 minutes 30 seconds

We managed to deploy ClusterControl and then PXC cluster using ClusterControl in 17 minutes and 30 seconds. The PXC deployment itself took 12 minutes and 5 seconds. At the end we have a working cluster, deployed according to the best practices. ClusterControl also ensures that the configuration of the cluster makes sense. In short, even if you don't really know anything about MySQL or Galera Cluster, you can have a production-ready cluster deployed in a couple of minutes. ClusterControl is not just a deployment tool, it is also management platform - makes things even easier for people not experienced with MySQL and Galera to identify performance problems (through advisors) and do management actions (scaling the cluster up and down, running backups, creating asynchronous slaves to Galera). What is important, ClusterControl will always be maintained and can be used to deploy all MySQL flavors (and not only MySQL/MariaDB, it also supports TimeScaleDB, PostgreSQL and MongoDB). It also worked out of the box, something which cannot be said about other methods we tested.

If you would like to experience the same, you can download ClusterControl for free. Let us know how you liked it.

How to Automate Migration from Standalone MySQL to Galera Cluster using Ansible

$
0
0

Database migrations don’t scale well. Typically you need to perform a great deal of tests before you can pull the trigger and switch from old to new. Migrations are usually done manually, as most of the process does not lend itself to automation. But that doesn’t mean there is no room for automation in the migration process. Imagine setting up a number of nodes with new software, provisioning them with data and configuring replication between old and new environments by hand. This takes days. Automation can be very useful when setting up a new environment and provisioning it with data. In this blog post, we will take a look at a very simple migration - from standalone Percona Server 5.7 to a 3-node Percona XtraDB Cluster 5.7. We will use Ansible to accomplish that.

Environment Description

First of all, one important disclaimer - what we are going to show here is only a draft of what you might like to run in production. It does work on our test environment but it may require modifications to make it suitable for your environment. In our tests we used four Ubuntu 16.04 VM’s deployed using Vagrant. One contains standalone Percona Server 5.7, remaining three will be used for Percona XtraDB Cluster nodes. We also use a separate node for running ansible playbooks, although this is not a requirement and the playbook can also be executed from one of the nodes. In addition, SSH connectivity is available between all of the nodes. You have to have connectivity from the host where you run ansible, but having the ability to ssh between nodes is useful (especially between master and new slave - we rely on this in the playbook).

Playbook Structure

Ansible playbooks typically share common structure - you create roles, which can be assigned to different hosts. Each role will contain tasks to be executed on it, templates that will be used, files that will be uploaded, variables which are defined for this particular playbook. In our case, the playbook is very simple.

.
├── inventory
├── playbook.yml
├── roles
│   ├── first_node
│   │   ├── my.cnf.j2
│   │   ├── tasks
│   │   │   └── main.yml
│   │   └── templates
│   │       └── my.cnf.j2
│   ├── galera
│   │   ├── tasks
│   │   │   └── main.yml
│   │   └── templates
│   │       └── my.cnf.j2
│   ├── master
│   │   └── tasks
│   │       └── main.yml
│   └── slave
│       └── tasks
│           └── main.yml
└── vars
    └── default.yml

We defined a couple of roles - we have a master role, which is intended to do some sanity checks on the standalone node. There is slave node, which will be executed on one of the Galera nodes to configure it for replication, and set up the asynchronous replication. Then we have a role for all Galera nodes and a role for the first Galera node to bootstrap the cluster from it. For Galera roles, we have a couple of templates that we will use to create my.cnf files. We will also use local .my.cnf to define a username and password. We have a file containing a couple of variables which we may want to customize, just like passwords. Finally we have an inventory file, which defines hosts on which we will run the playbook, we also have the playbook file with information on how exactly things should be executed. Let’s take a look at the individual bits.

Inventory File

This is a very simple file.

[galera]
10.0.0.142
10.0.0.143
10.0.0.144

[first_node]
10.0.0.142

[master]
10.0.0.141

We have three groups, ‘galera’, which contains all Galera nodes, ‘first_node’, which we will use for the bootstrap and finally ‘master’, which contains our standalone Percona Server node.

Playbook.yml

The file playbook.yml contains the general guidelines on how the playbook should be executed.

-   hosts: master
    gather_facts: yes
    become: true
    pre_tasks:
    -   name: Install Python2
        raw: test -e /usr/bin/python || (apt -y update && apt install -y python-minimal)
    vars_files:
        -   vars/default.yml
    roles:
    -   { role: master }

As you can see, we start with the standalone node and we apply tasks related to the role ‘master’ (we will discuss this in details further down in this post).

-   hosts: first_node
    gather_facts: yes
    become: true
    pre_tasks:
    -   name: Install Python2
        raw: test -e /usr/bin/python || (apt -y update && apt install -y python-minimal)
    vars_files:
        -   vars/default.yml
    roles:
    -   { role: first_node }
    -   { role: slave }

Second, we go to node defined in ‘first_node’ group and we apply two roles: ‘first_node’ and ‘slave’. The former is intended to deploy a single node PXC cluster, the later will configure it to work as a slave and set up the replication.

-   hosts: galera
    gather_facts: yes
    become: true
    pre_tasks:
    -   name: Install Python2
        raw: test -e /usr/bin/python || (apt -y update && apt install -y python-minimal)
    vars_files:
        -   vars/default.yml
    roles:
    -   { role: galera }

Finally, we go through all Galera nodes and apply ‘galera’ role on all of them.

Severalnines
 
DevOps Guide to Database Management
Learn about what you need to know to automate and manage your open source databases

Variables

Before we begin to look into roles, we want to mention default variables that we defined for this playbook.

sst_user: "sstuser"
sst_password: "pa55w0rd"
root_password: "pass"
repl_user: "repl_user"
repl_password: "repl1cati0n"

As we stated, this is a very simple playbook without much options for customization. You can configure users and passwords and this is basically it. One gotcha - please make sure that the standalone node’s root password matches ‘root_password’ here as otherwise the playbook wouldn’t be able to connect there (it can be extended to handle it but we did not cover that).

This file is without much of a value but, as a rule of thumb, you want to encrypt any file which contains credentials. Obviously, this is for the security reasons. Ansible comes with ansible-vault, which can be used to encrypt and decrypt files. We will not cover details here, all you need to know is available in the documentation. In short, you can easily encrypt files using passwords and configure your environment so that the playbooks can be decrypted automatically using password from file or passed by hand.

Roles

In this section we will go over roles that are defined in the playbook, summarizing what they are intended to perform.

Master role

As we stated, this role is intended to run a sanity check on the configuration of the standalone MySQL. It will install required packages like percona-xtrabackup-24. It also creates replication user on the master node. A configuration is reviewed to ensure that the server_id and other replication and binary log-related settings are set. GTID is also enabled as we will rely on it for replication.

First_node role

Here, the first Galera node is installed. Percona repository will be configured, my.cnf will be created from the template. PXC will be installed. We also run some cleanup to remove unneeded users and to create those, which will be required (root user with the password of our choosing, user required for SST). Finally, cluster is bootstrapped using this node. We rely on the empty ‘wsrep_cluster_address’ as a way to initialize the cluster. This is why later we still execute ‘galera’ role on the first node - to swap initial my.cnf with the final one, containing ‘wsrep_cluster_address’ with all the members of the cluster. One thing worth remembering - when you create a root user with password you have to be careful not to get locked off MySQL so that Ansible could execute other steps of the playbook. One way to do that is to provide .my.cnf with correct user and password. Another would be to remember to always set correct login_user and login_password in ‘mysql_user’ module.

Slave role

This role is all about configuring replication between standalone node and the single node PXC cluster. We use xtrabackup to get the data, we also check for executed gtid in xtrabackup_binlog_info to ensure the backup will be restored properly and that replication can be configured. We also perform a bit of the configuration, making sure that the slave node can use GTID replication. There is a couple of gotchas here - it is not possible to run ‘RESET MASTER’ using ‘mysql_replication’ module as of Ansible 2.7.10, it should be possible to do that in 2.8, whenever it will come out. We had to use ‘shell’ module to run MySQL CLI commands. When rebuilding Galera node from external source, you have to remember to re-create any required users (at least user used for SST). Otherwise the remaining nodes will not be able to join the cluster.

Galera role

Finally, this is the role in which we install PXC on remaining two nodes. We run it on all nodes, the initial one will get “production” my.cnf instead of its “bootstrap” version. Remaining two nodes will have PXC installed and they will get SST from the first node in the cluster.

Summary

As you can see, you can easily create a simple, reusable Ansible playbook which can be used for deploying Percona XtraDB Cluster and configuring it to be a slave of standalone MySQL node. To be honest, for migrating a single server, this will probably have no point as doing the same manually will be faster. Still, if you expect you will have to re-execute this process a couple of times, it will definitely make sense to automate it and make it more time efficient. As we stated at the beginning, this is by no means production-ready playbook. It is more of a proof of concept, something you may extend to make it suitable for your environment. You can find archive with the playbook here: http://severalnines.com/sites/default/files/ansible.tar.gz

We hope you found this blog post interesting and valuable, do not hesitate to share your thoughts.

Viewing all 97 articles
Browse latest View live